This gallery portrays a collection of Local Optima Network visualisations. We have categorised the images by problem domain, and within each domain by the research paper most closely associated with the image. Not all the images in the gallery appeared in the named papers but were generated in a similar way as those in the paper. Most of the images were generated with the igraph package using the R software environment. The 3D plots and animations were generated with the OpenGL R package rgl. Different plots reflect different problem instances, graph layouts (mainly force-directed algorithms such as Fruchterman-Reingold and Kamada-Kawai), search operators and decorations of nodes and edges. For example, the colour of nodes reflects either the connected component/funnel membership or the fitness value (or range of values). The size of nodes represents either their incoming degree or their fitness value. More information and a large version of an image are given when clicking it.
Filter
Travelling Salesman:
Quadratic Assignment:
NK Landscapes:
Number Partitioning:
Genetic Improvement:
Protein Design:
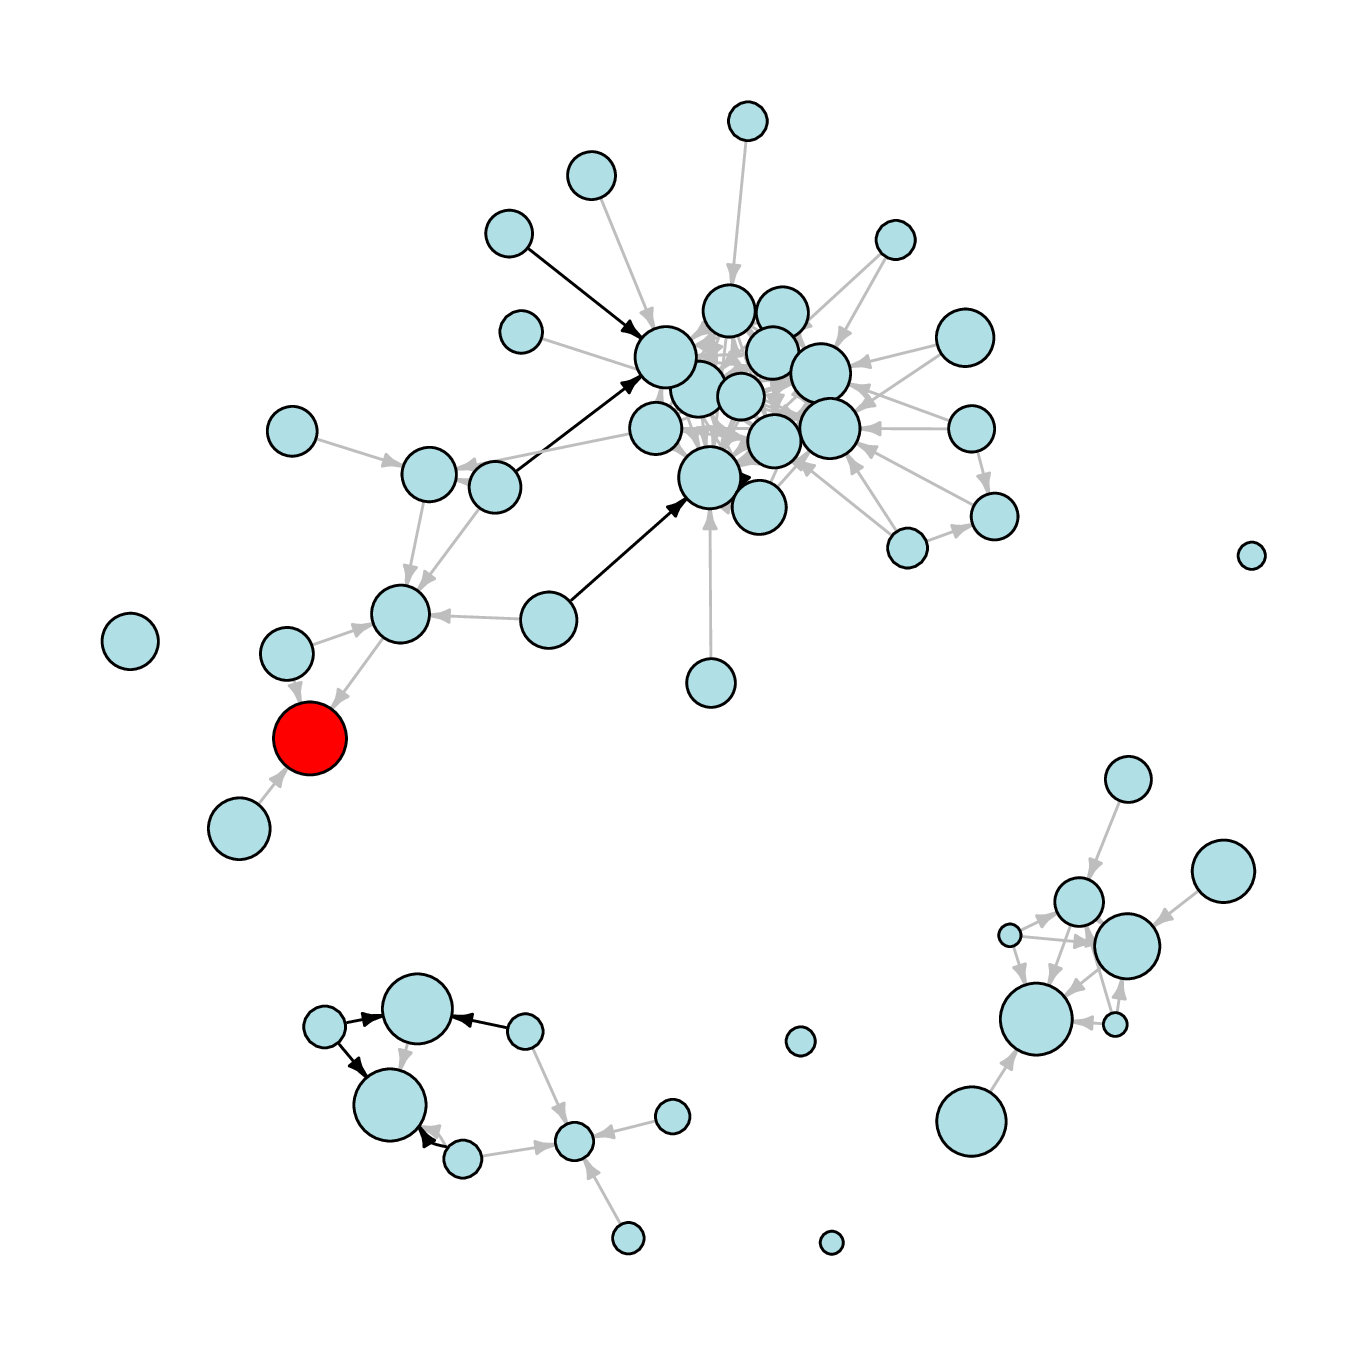
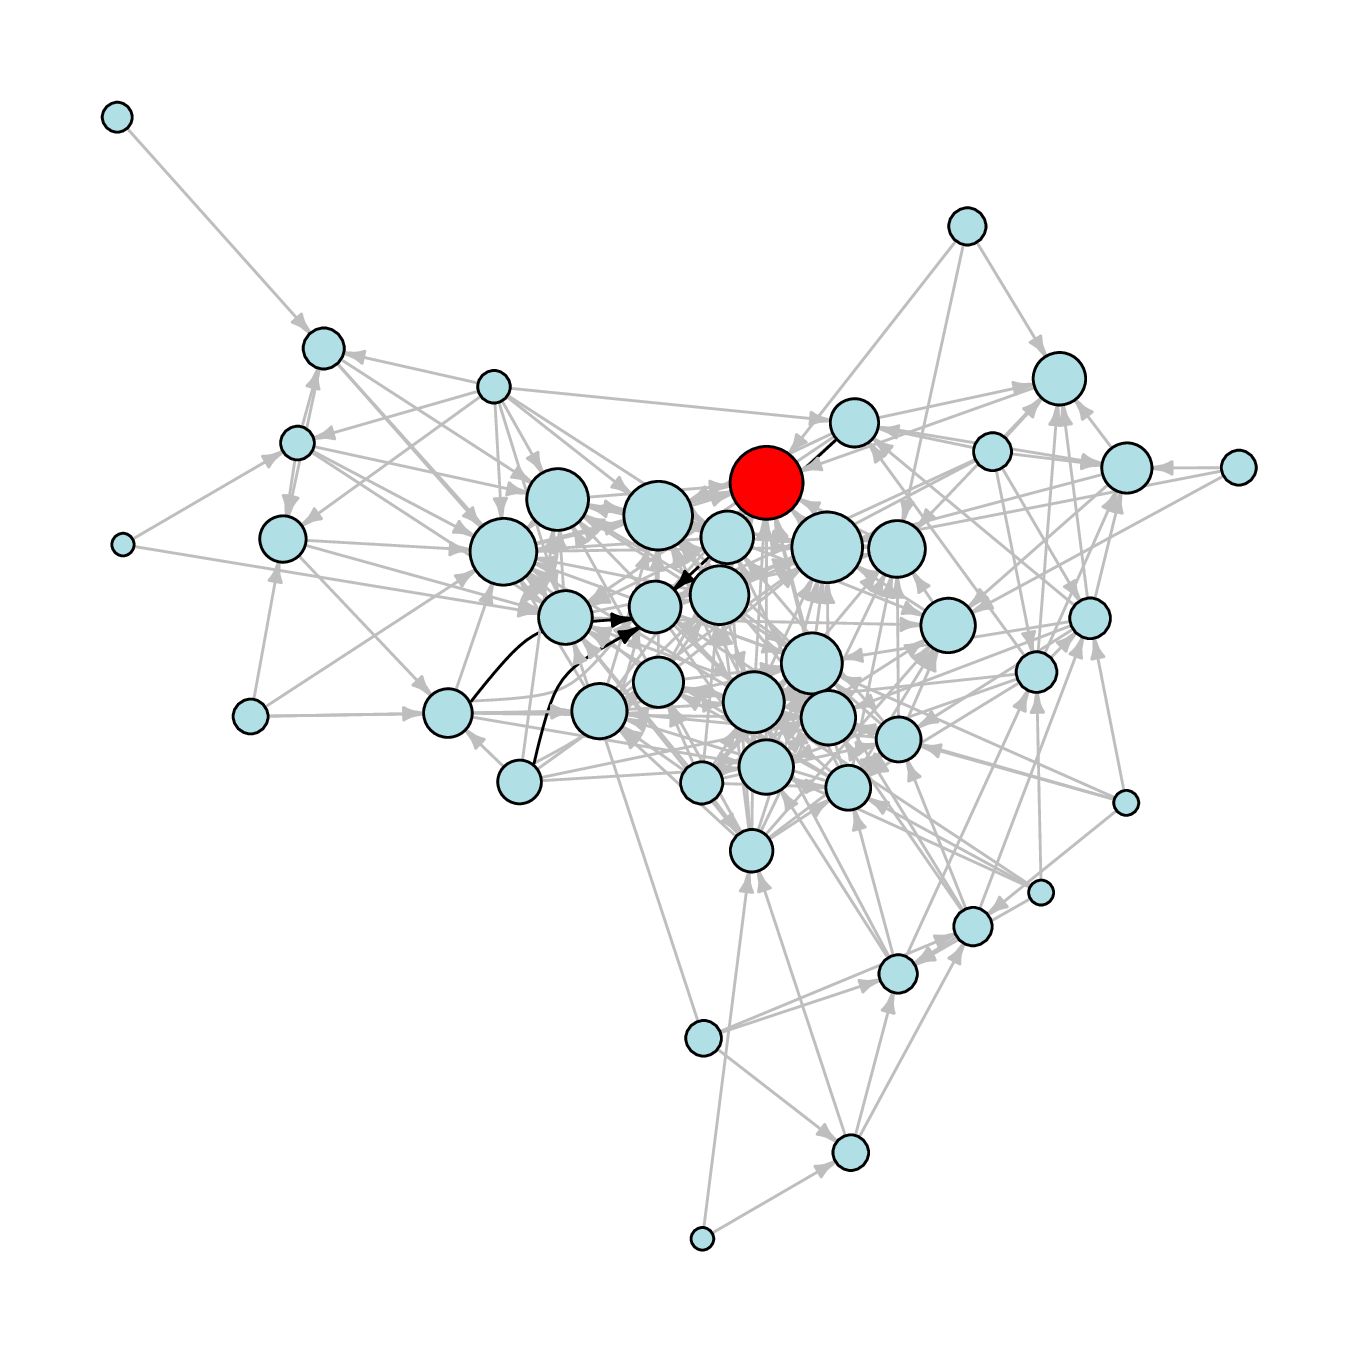
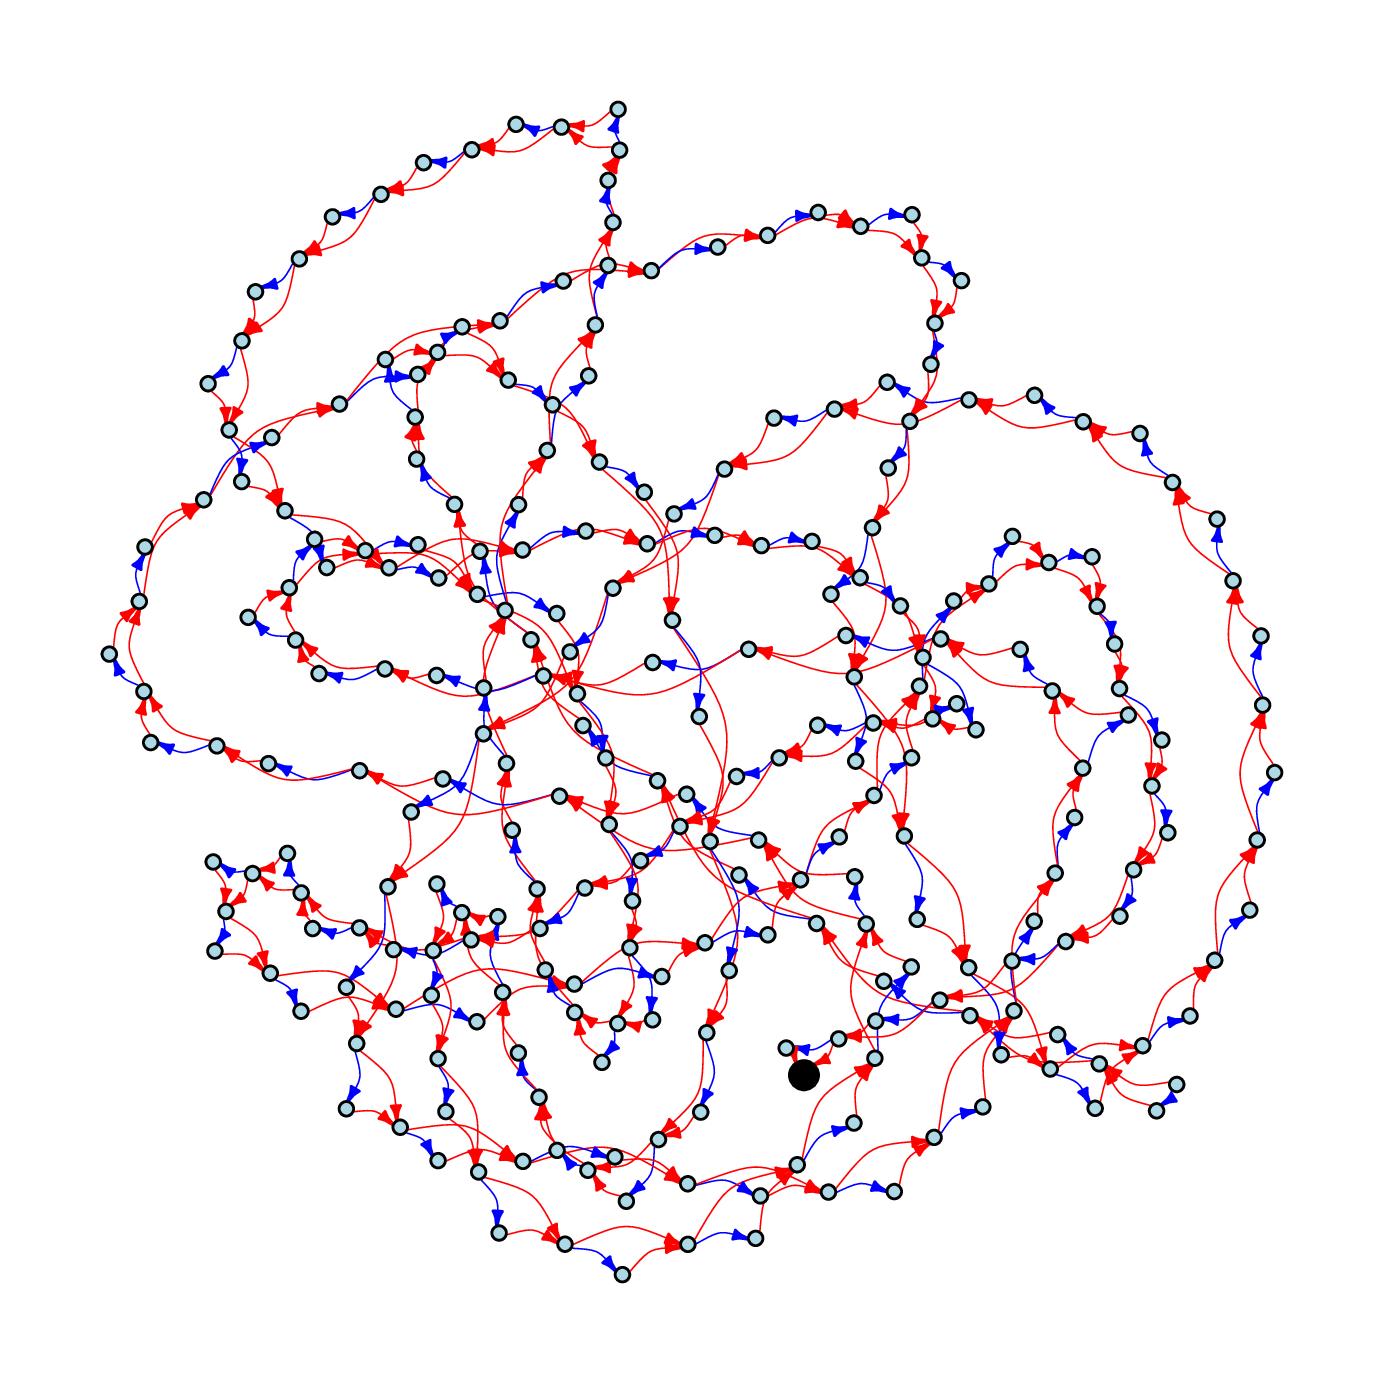
These LONs are the result of sampling the landscape of TSP instances. They were generated by aggregating multiple runs of the Chained Lin-Kernighan heuristic, which is a form of iterated local search. Nodes are Lin-Kernighan optima and edges are escape transitions with the double-bridge move. We have studied benchmark instances from the TSPLIB with sizes in the range of 500-1500 cities, and synthetic instances (uniform and clustered points) in the same size range produced with the DIMACS instance generator code.
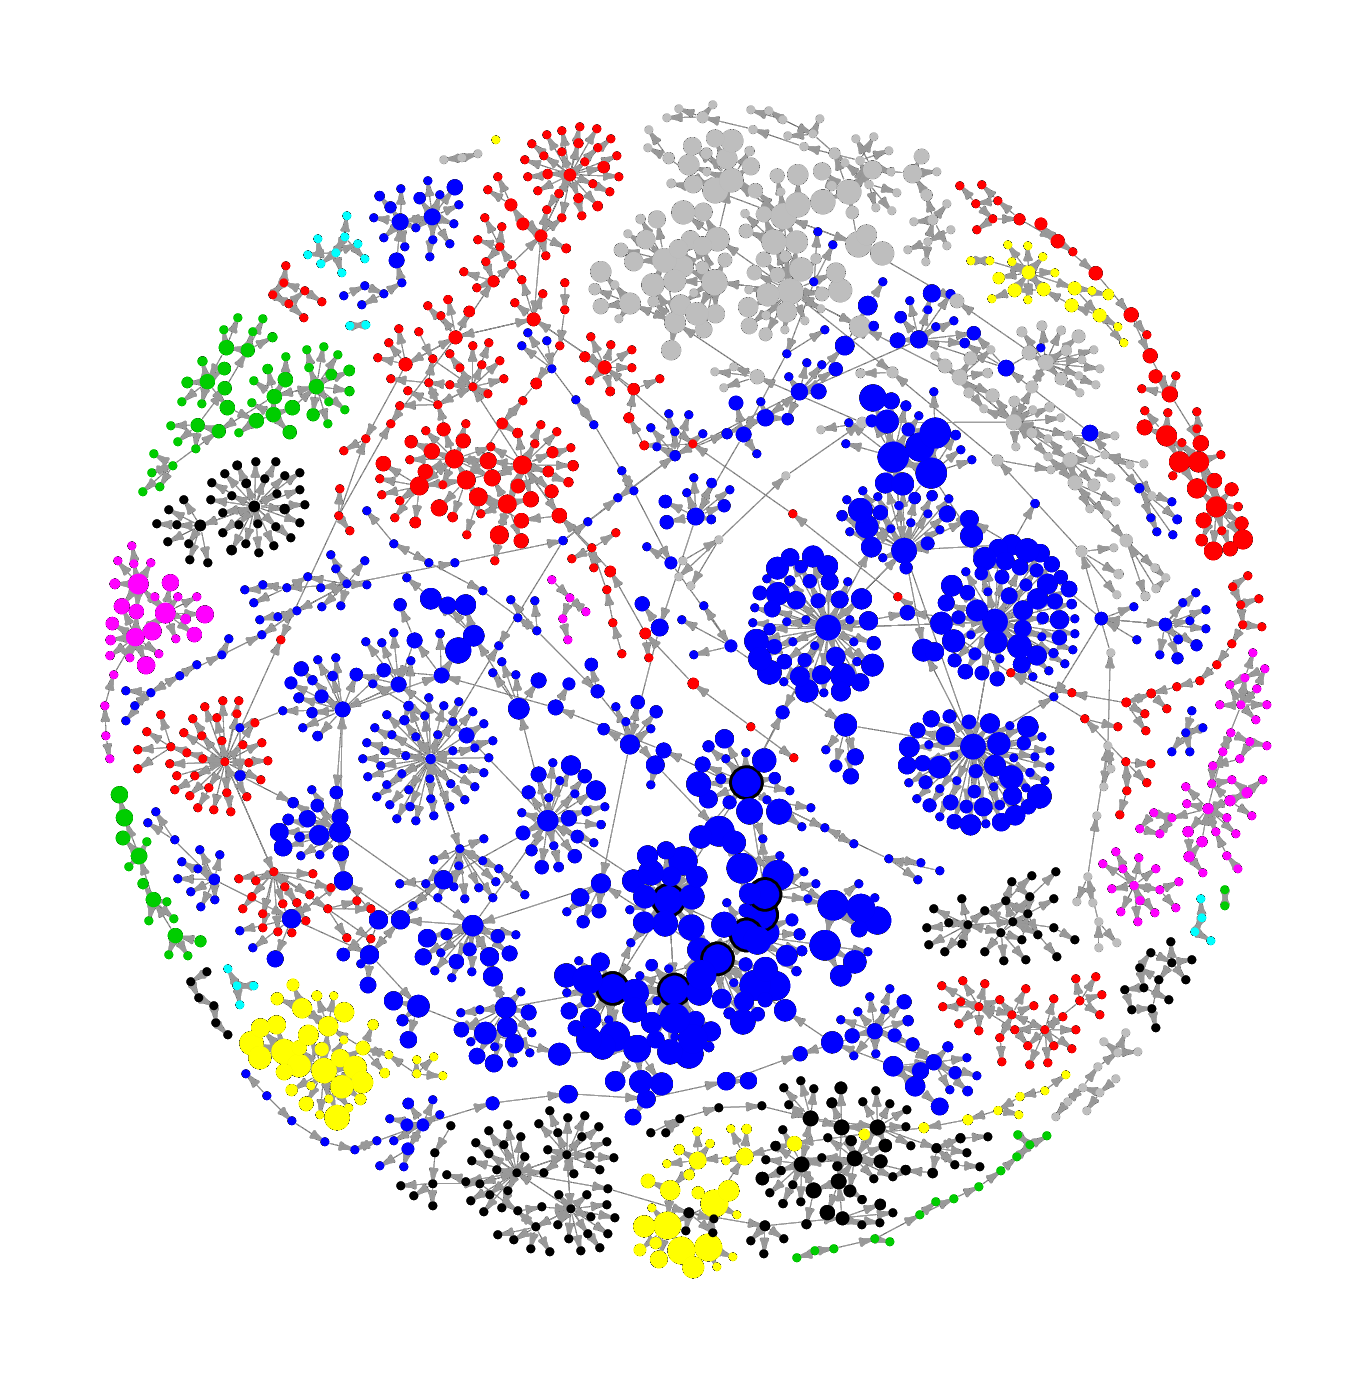
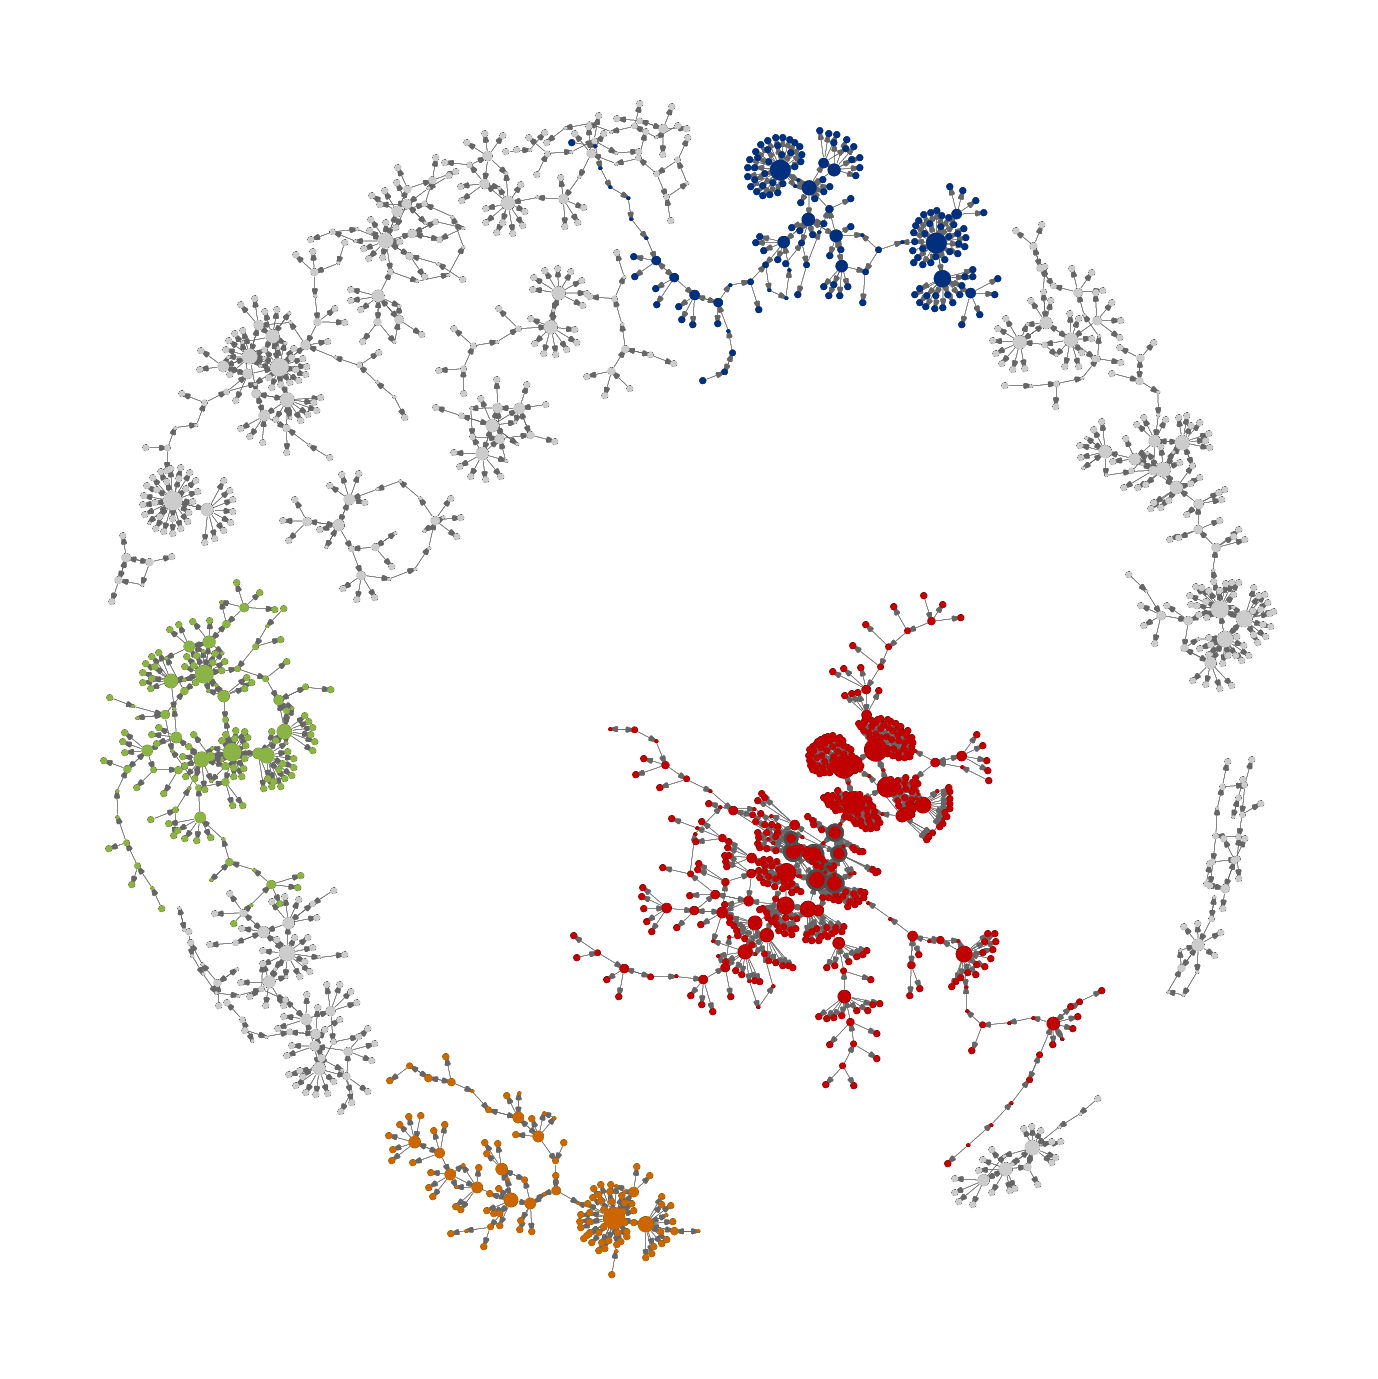
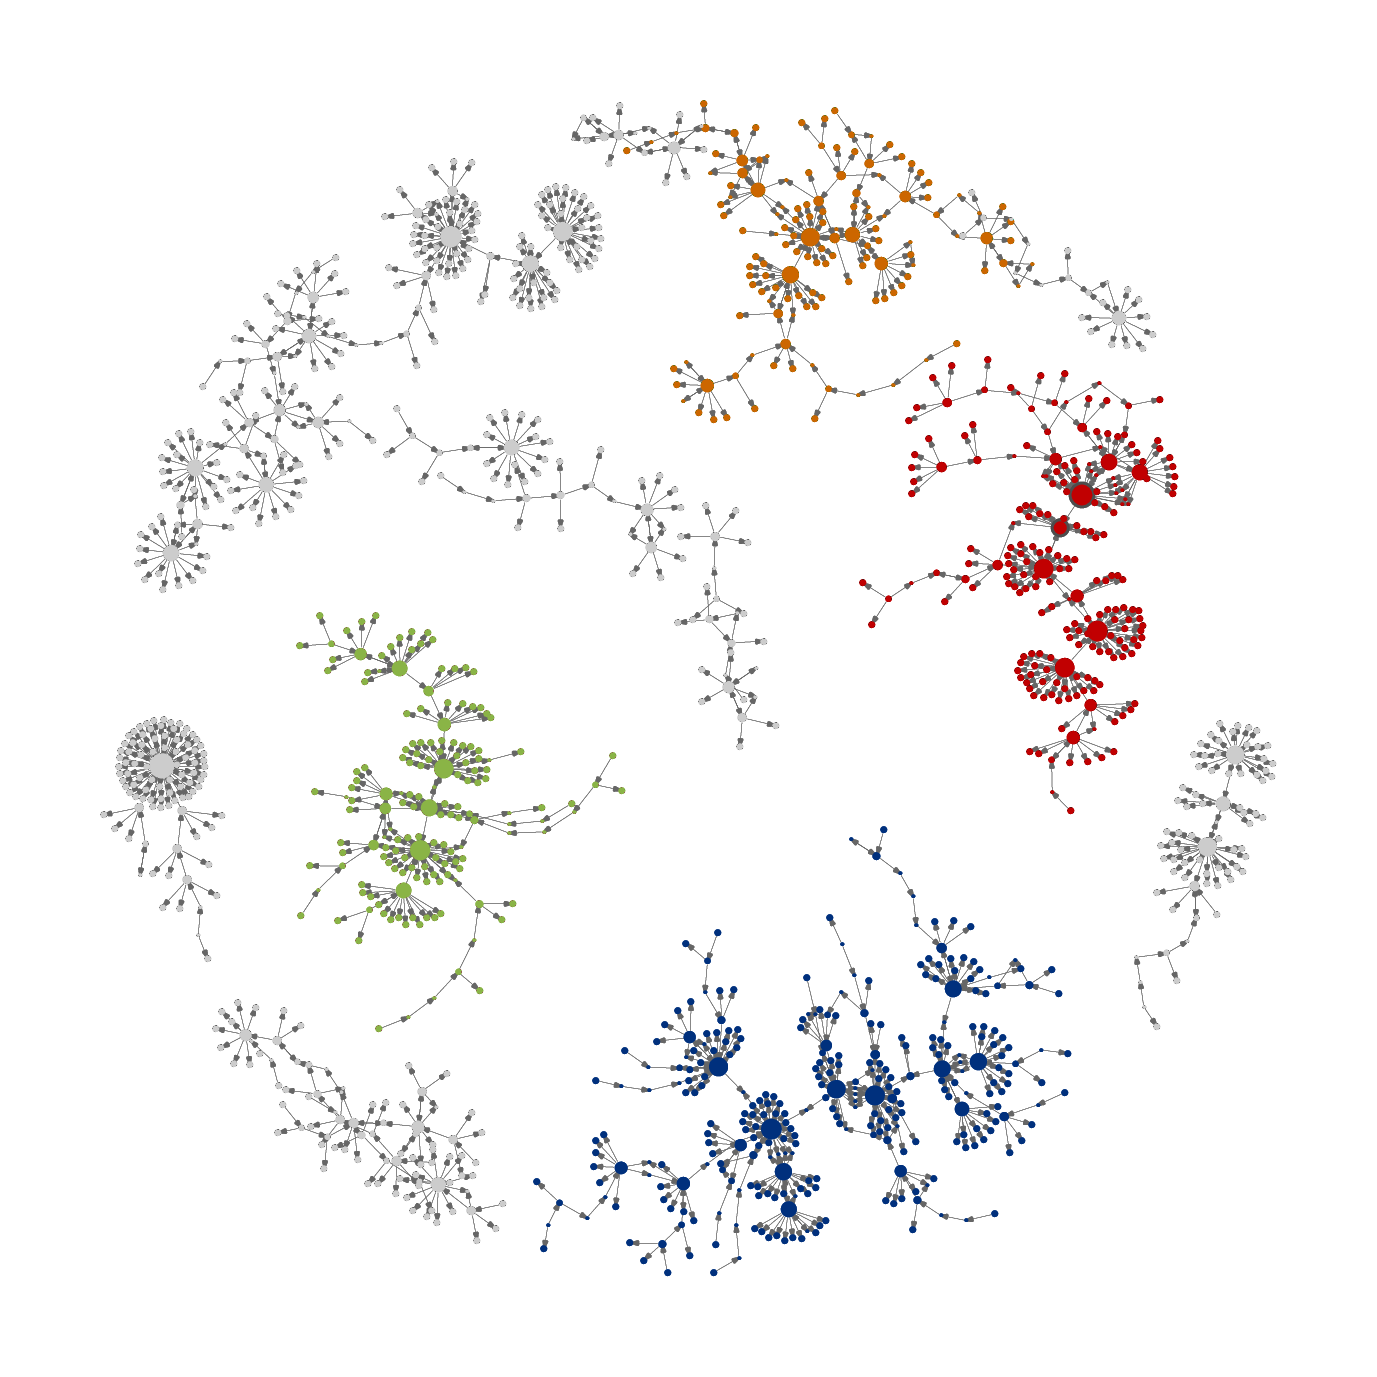
Deconstructing the Big-Valley, EvoCOP 2016
We analysed the LONs of representative instances from the TSPLIB, the idea was to explore their funnel structure. The colors of nodes identify connected components which we claimed are associated with the notion of funnels. TSP instances were found to have several funnels, deconstructing the idea of a single funnel or valley. The first two rows use Fruchterman-Reingold, while the last two rows use Kamada-Kawai graph layout, which spreads out the connected components (funnels). The last row features TSP instances with neutrality (sequences of local optima with the same fitness), which appear as intriguing worm-like structures.
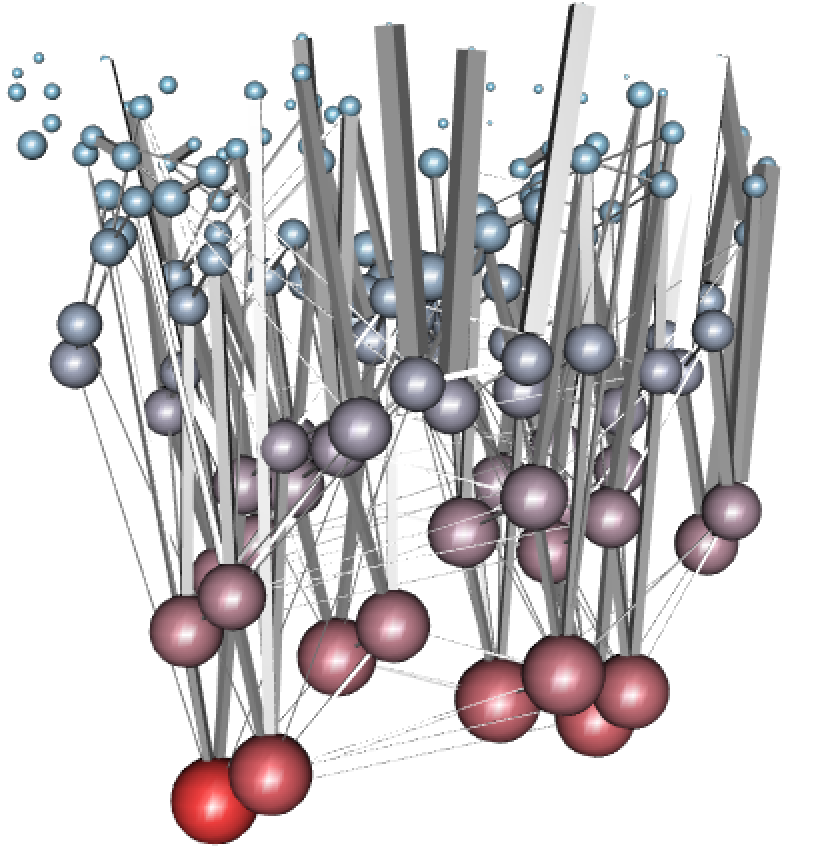
Funnel Floors and 3D LON Visualisations, GECCO 2016
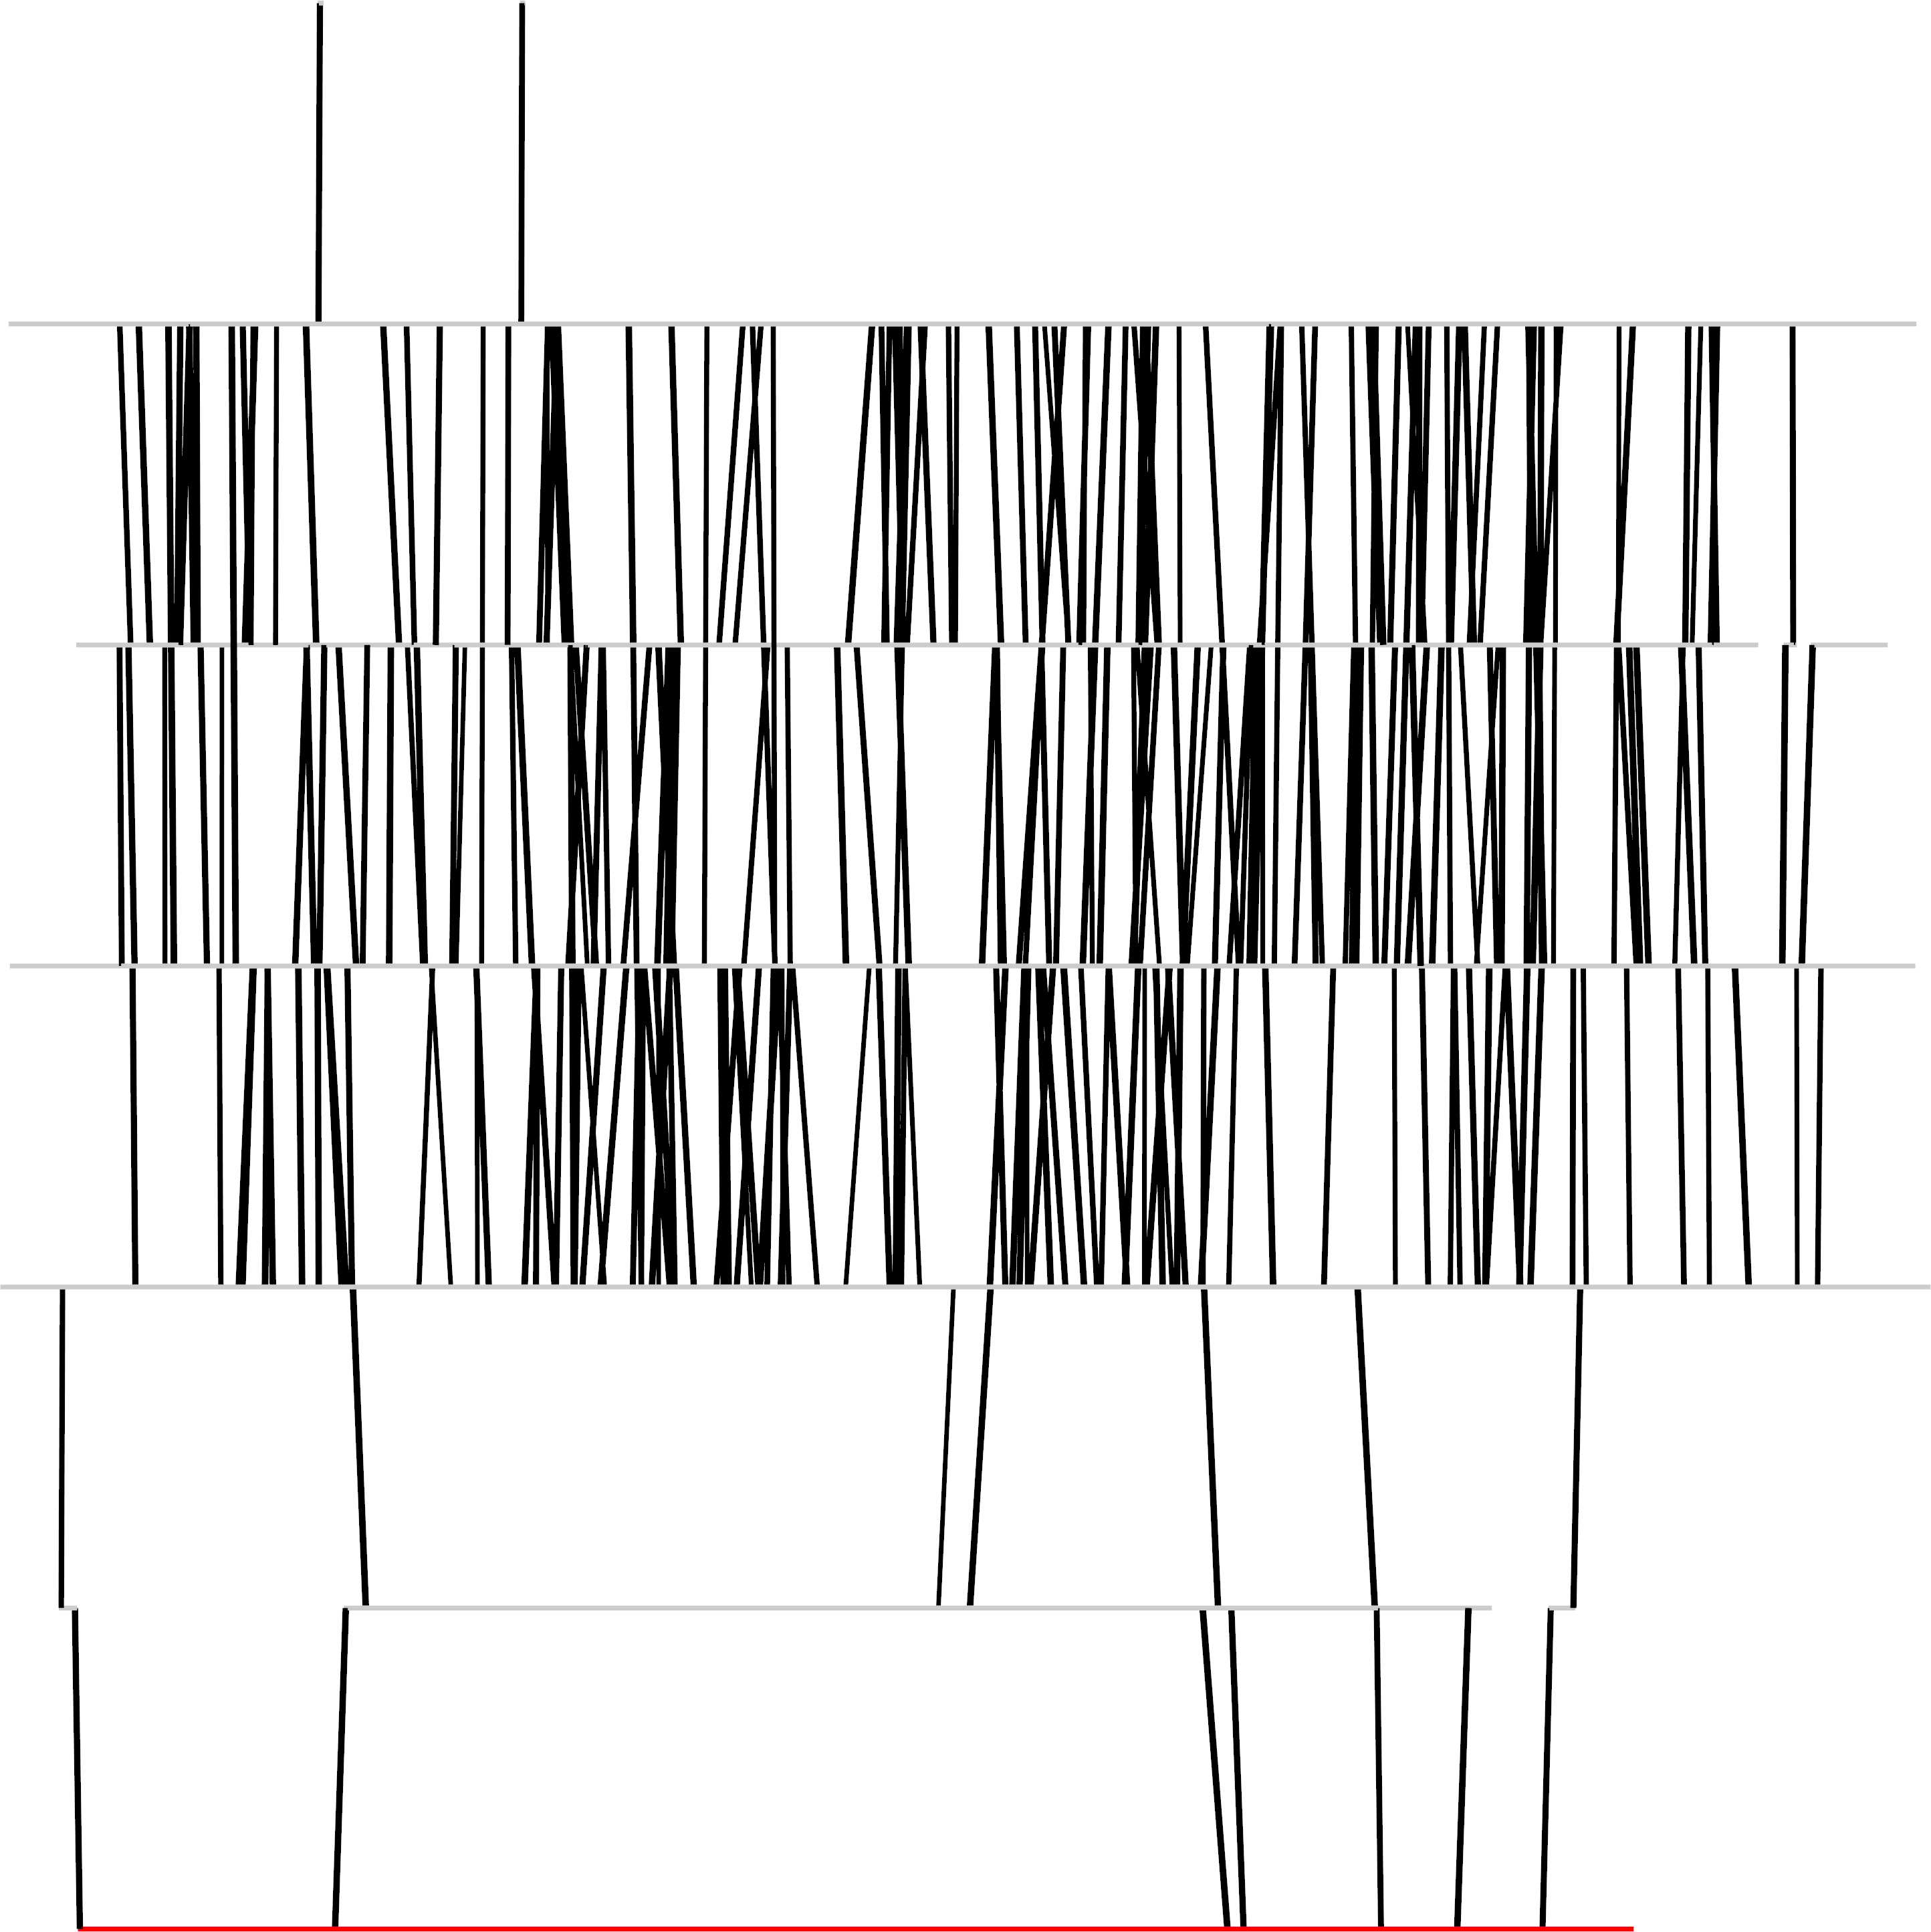
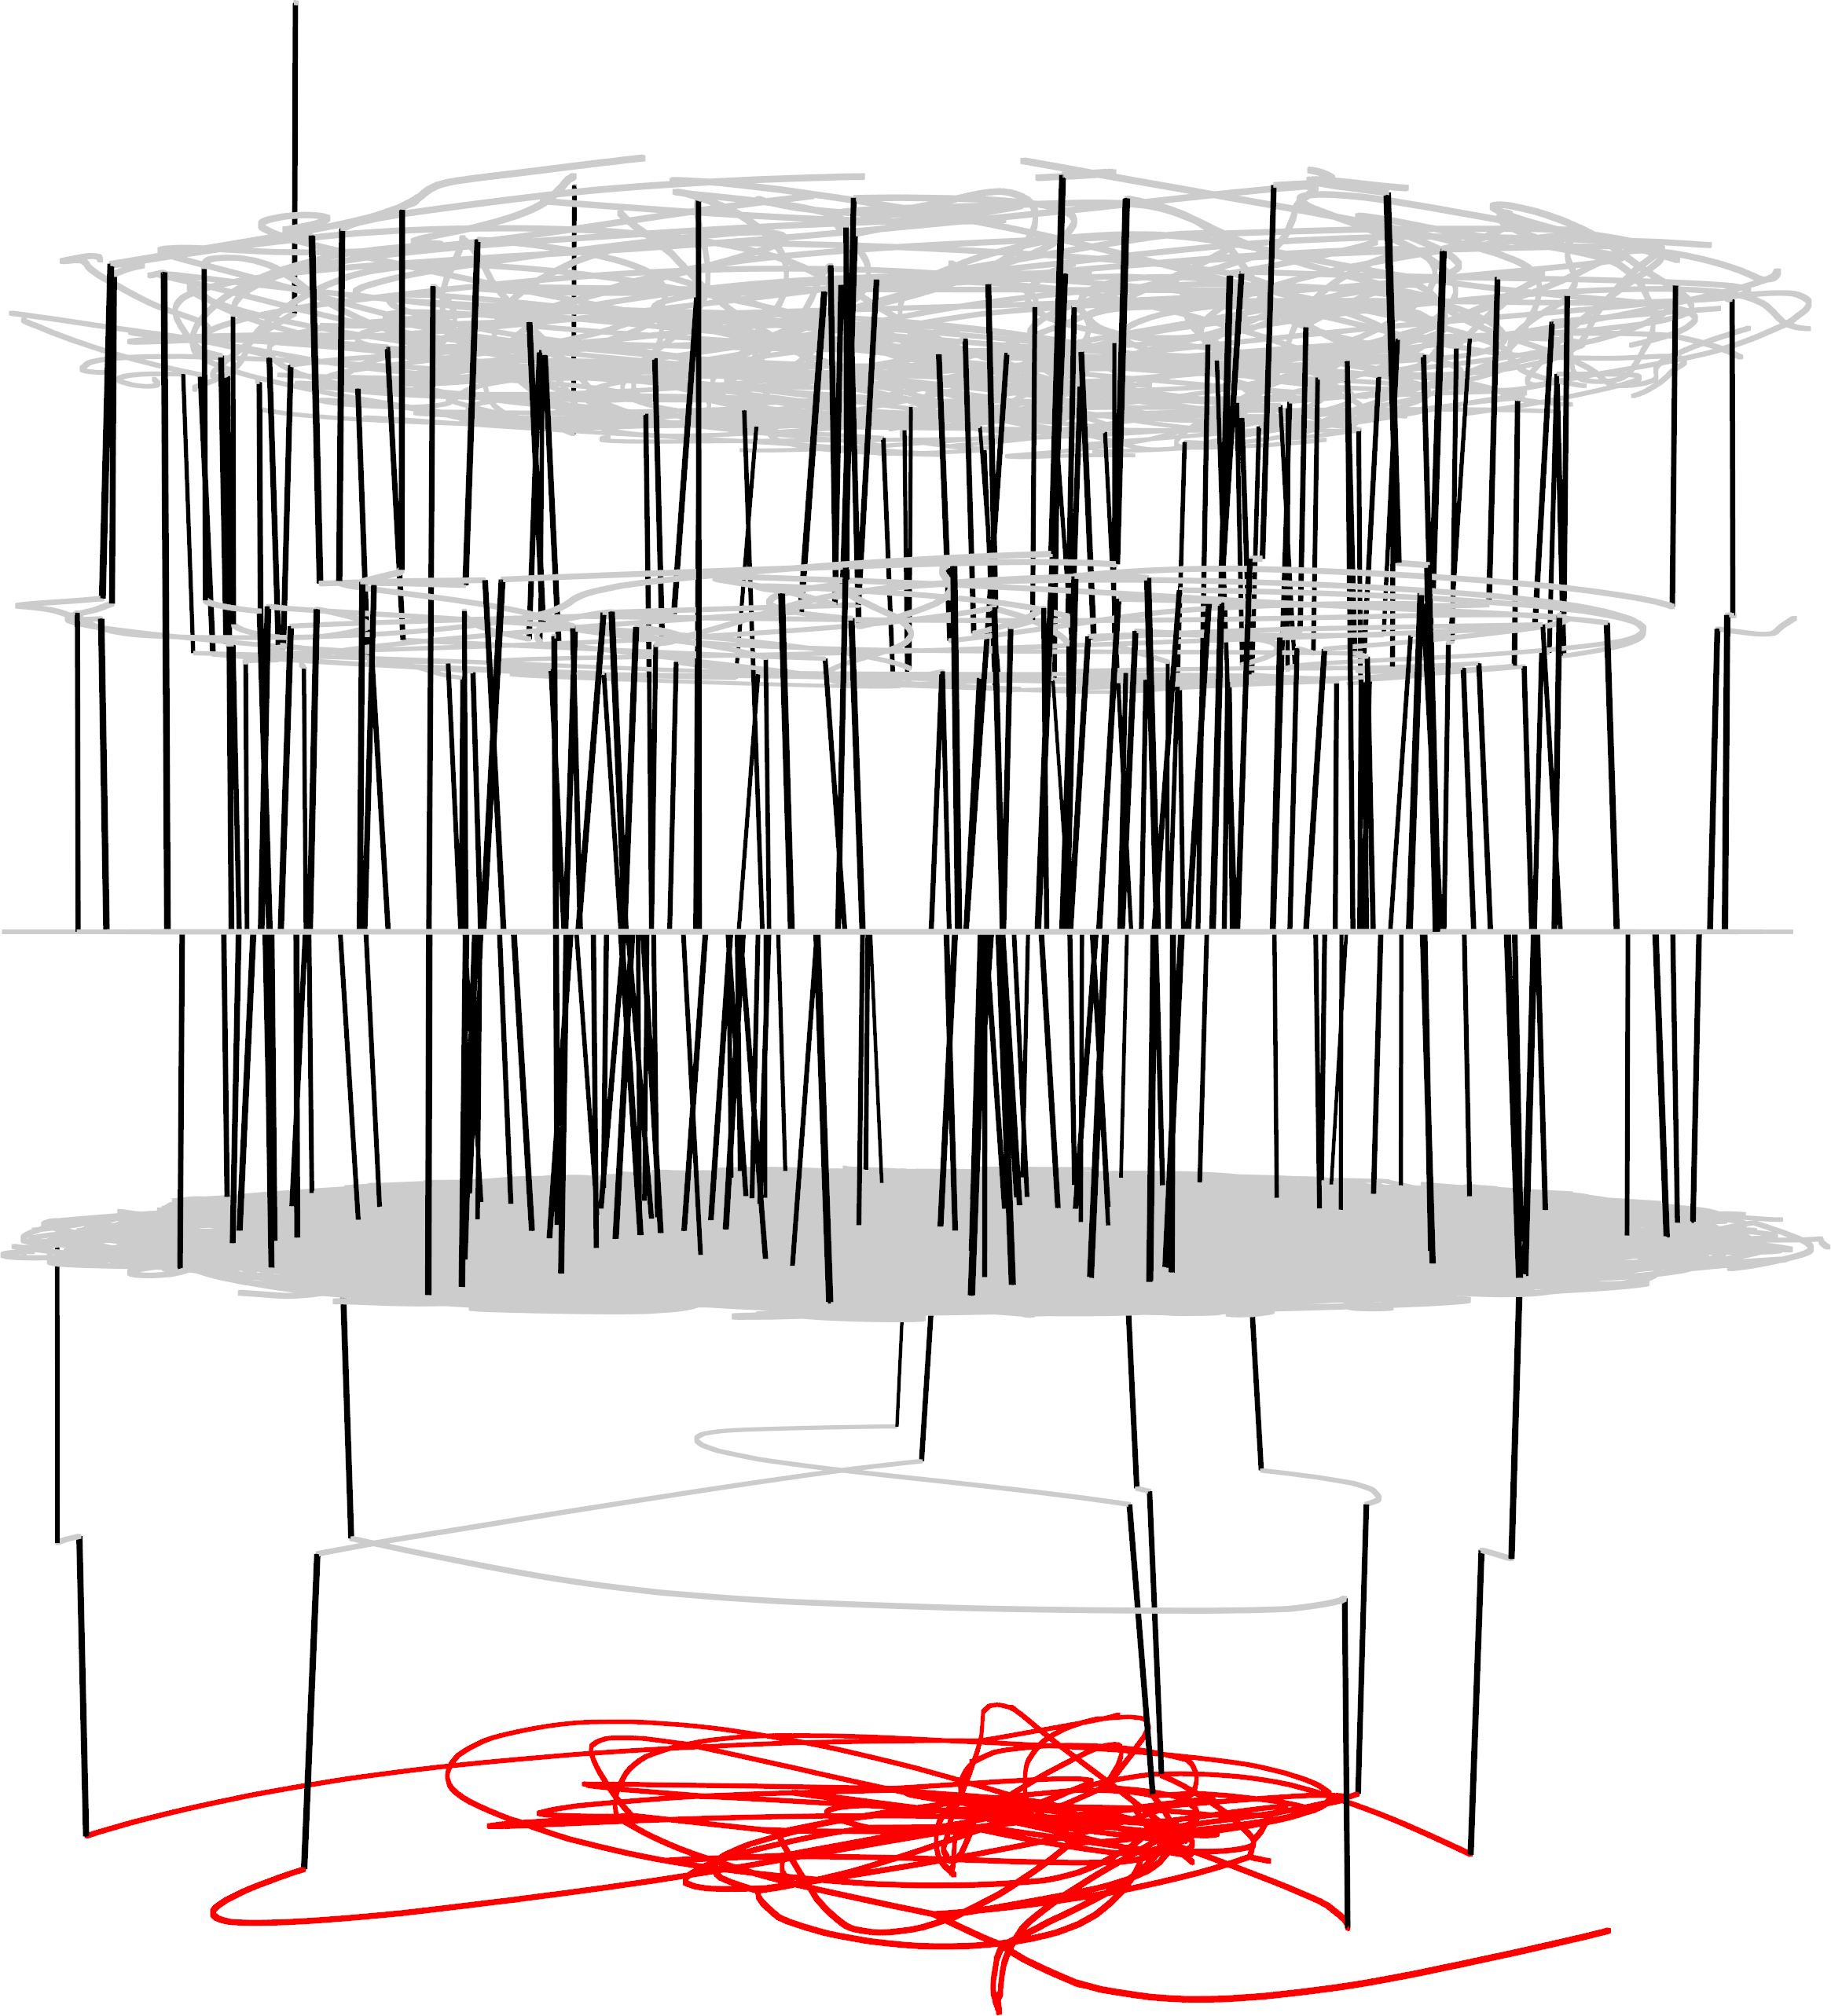
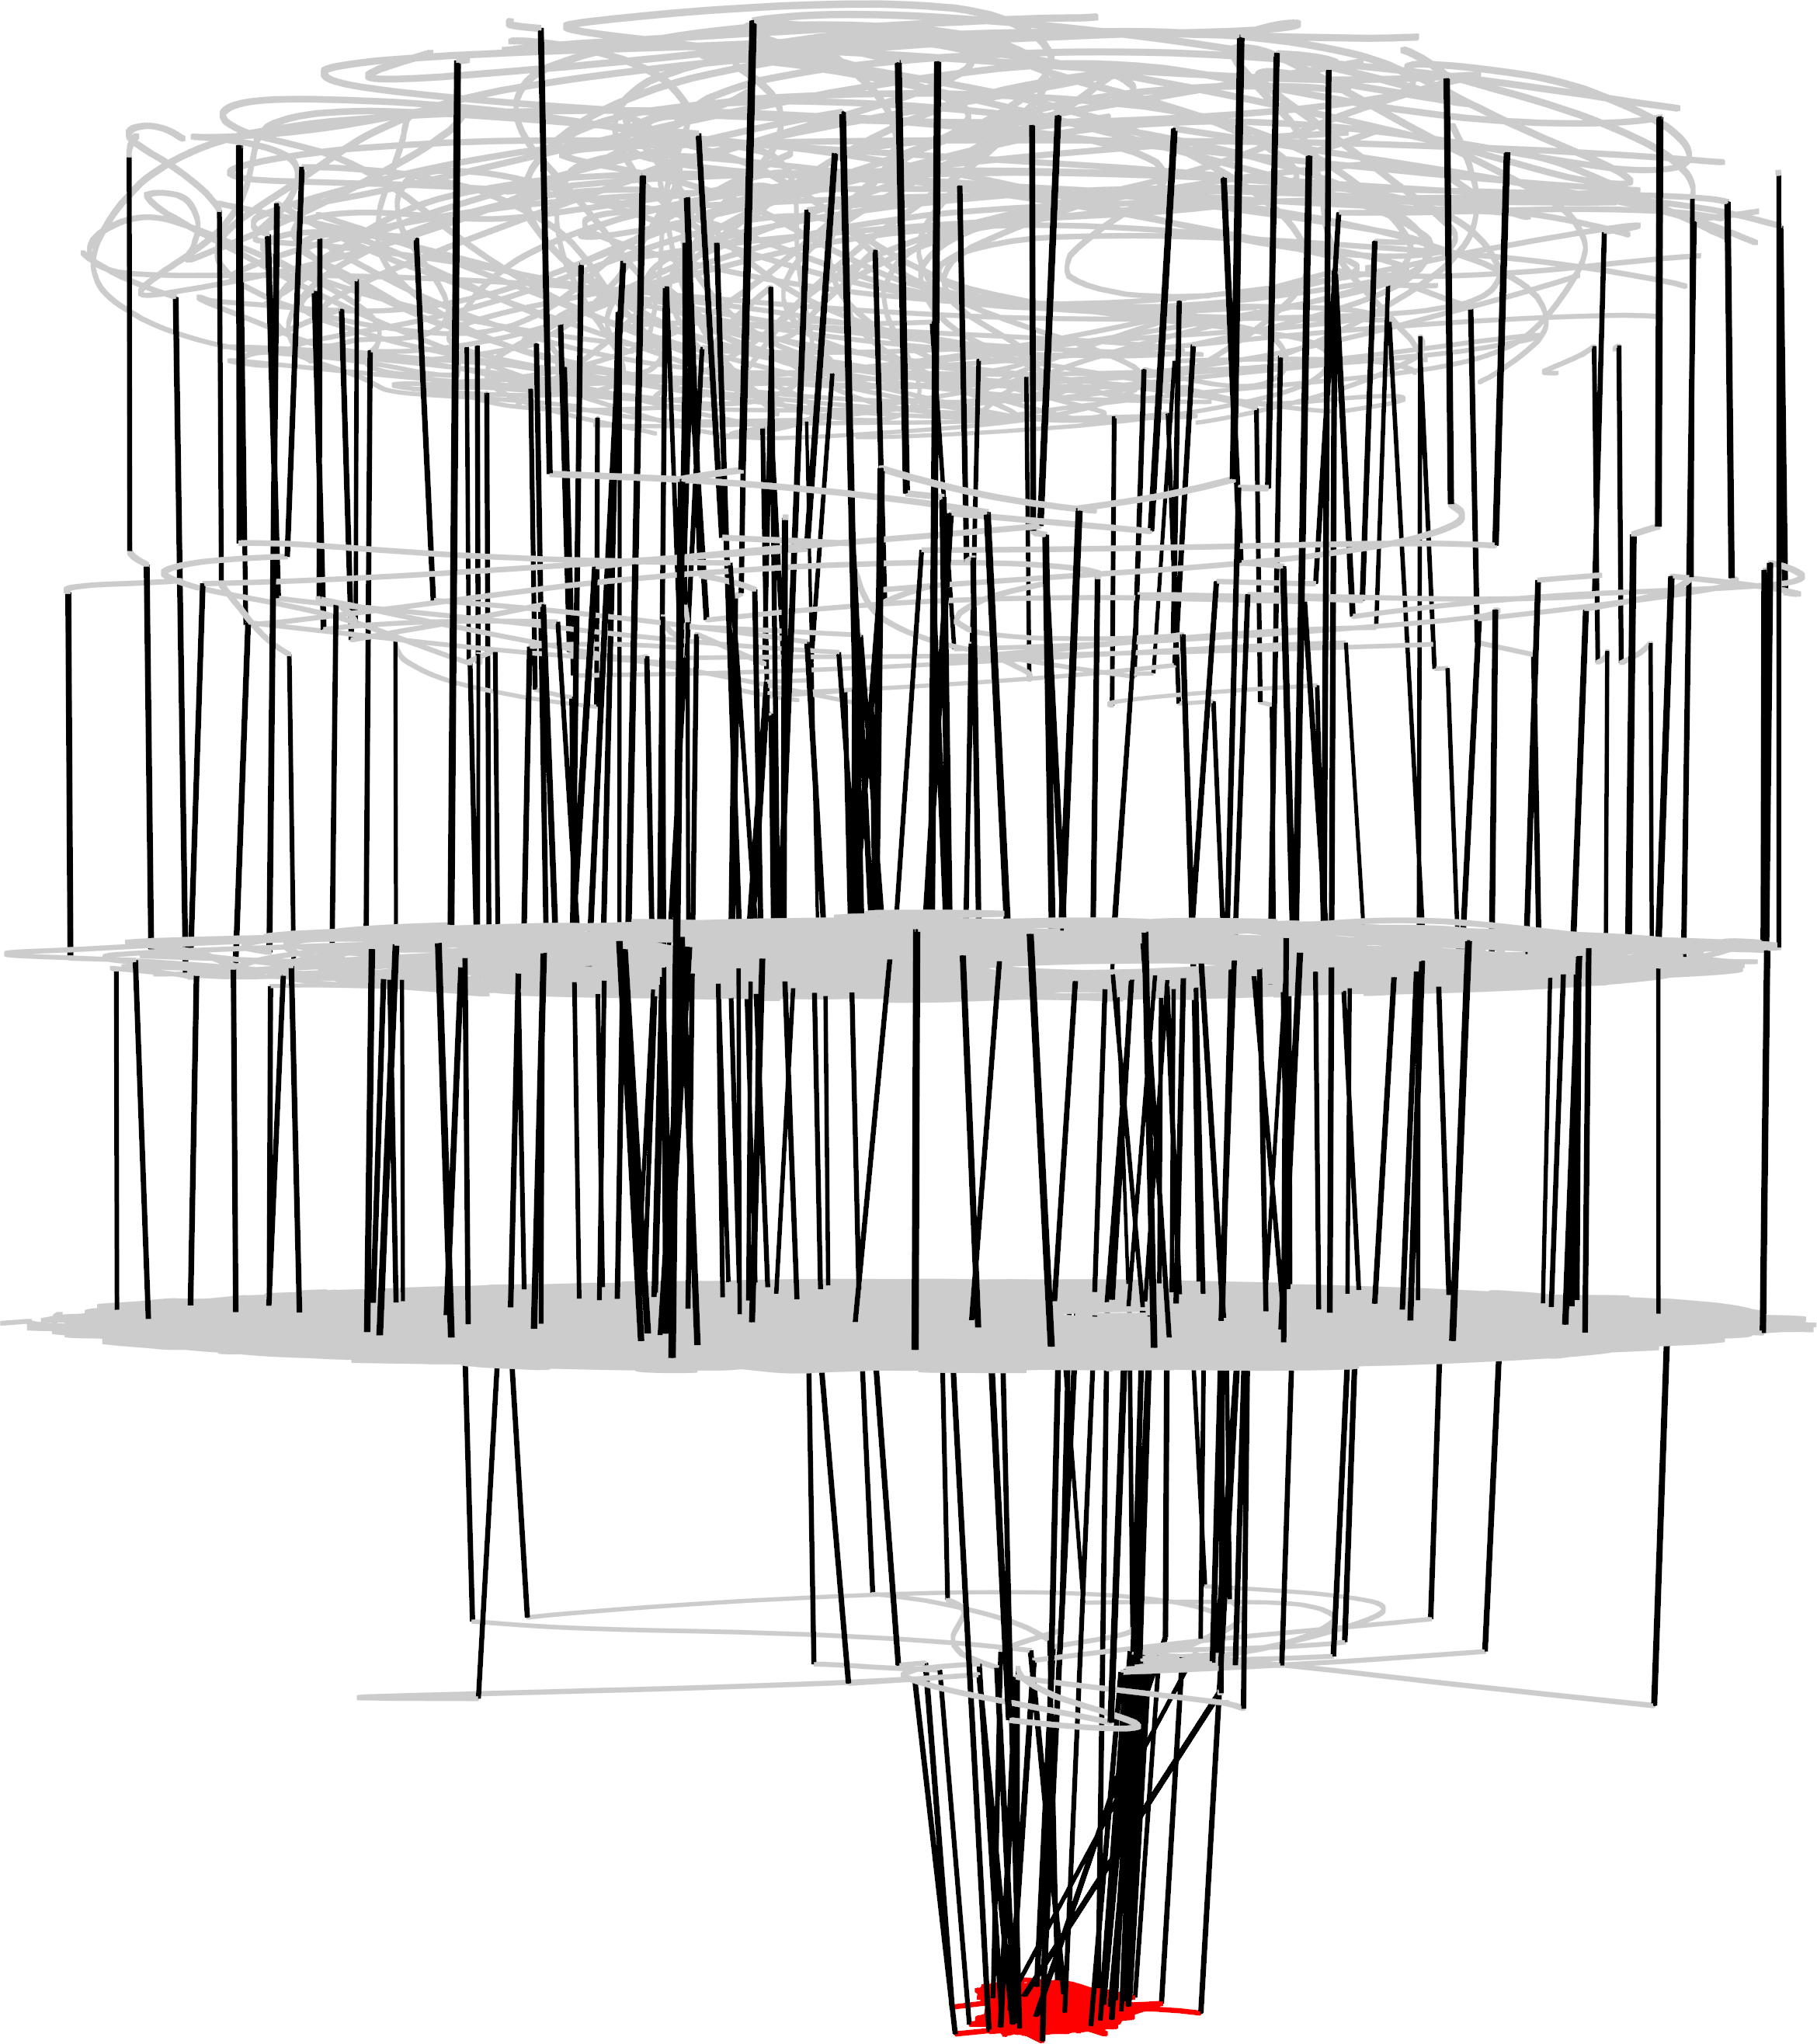
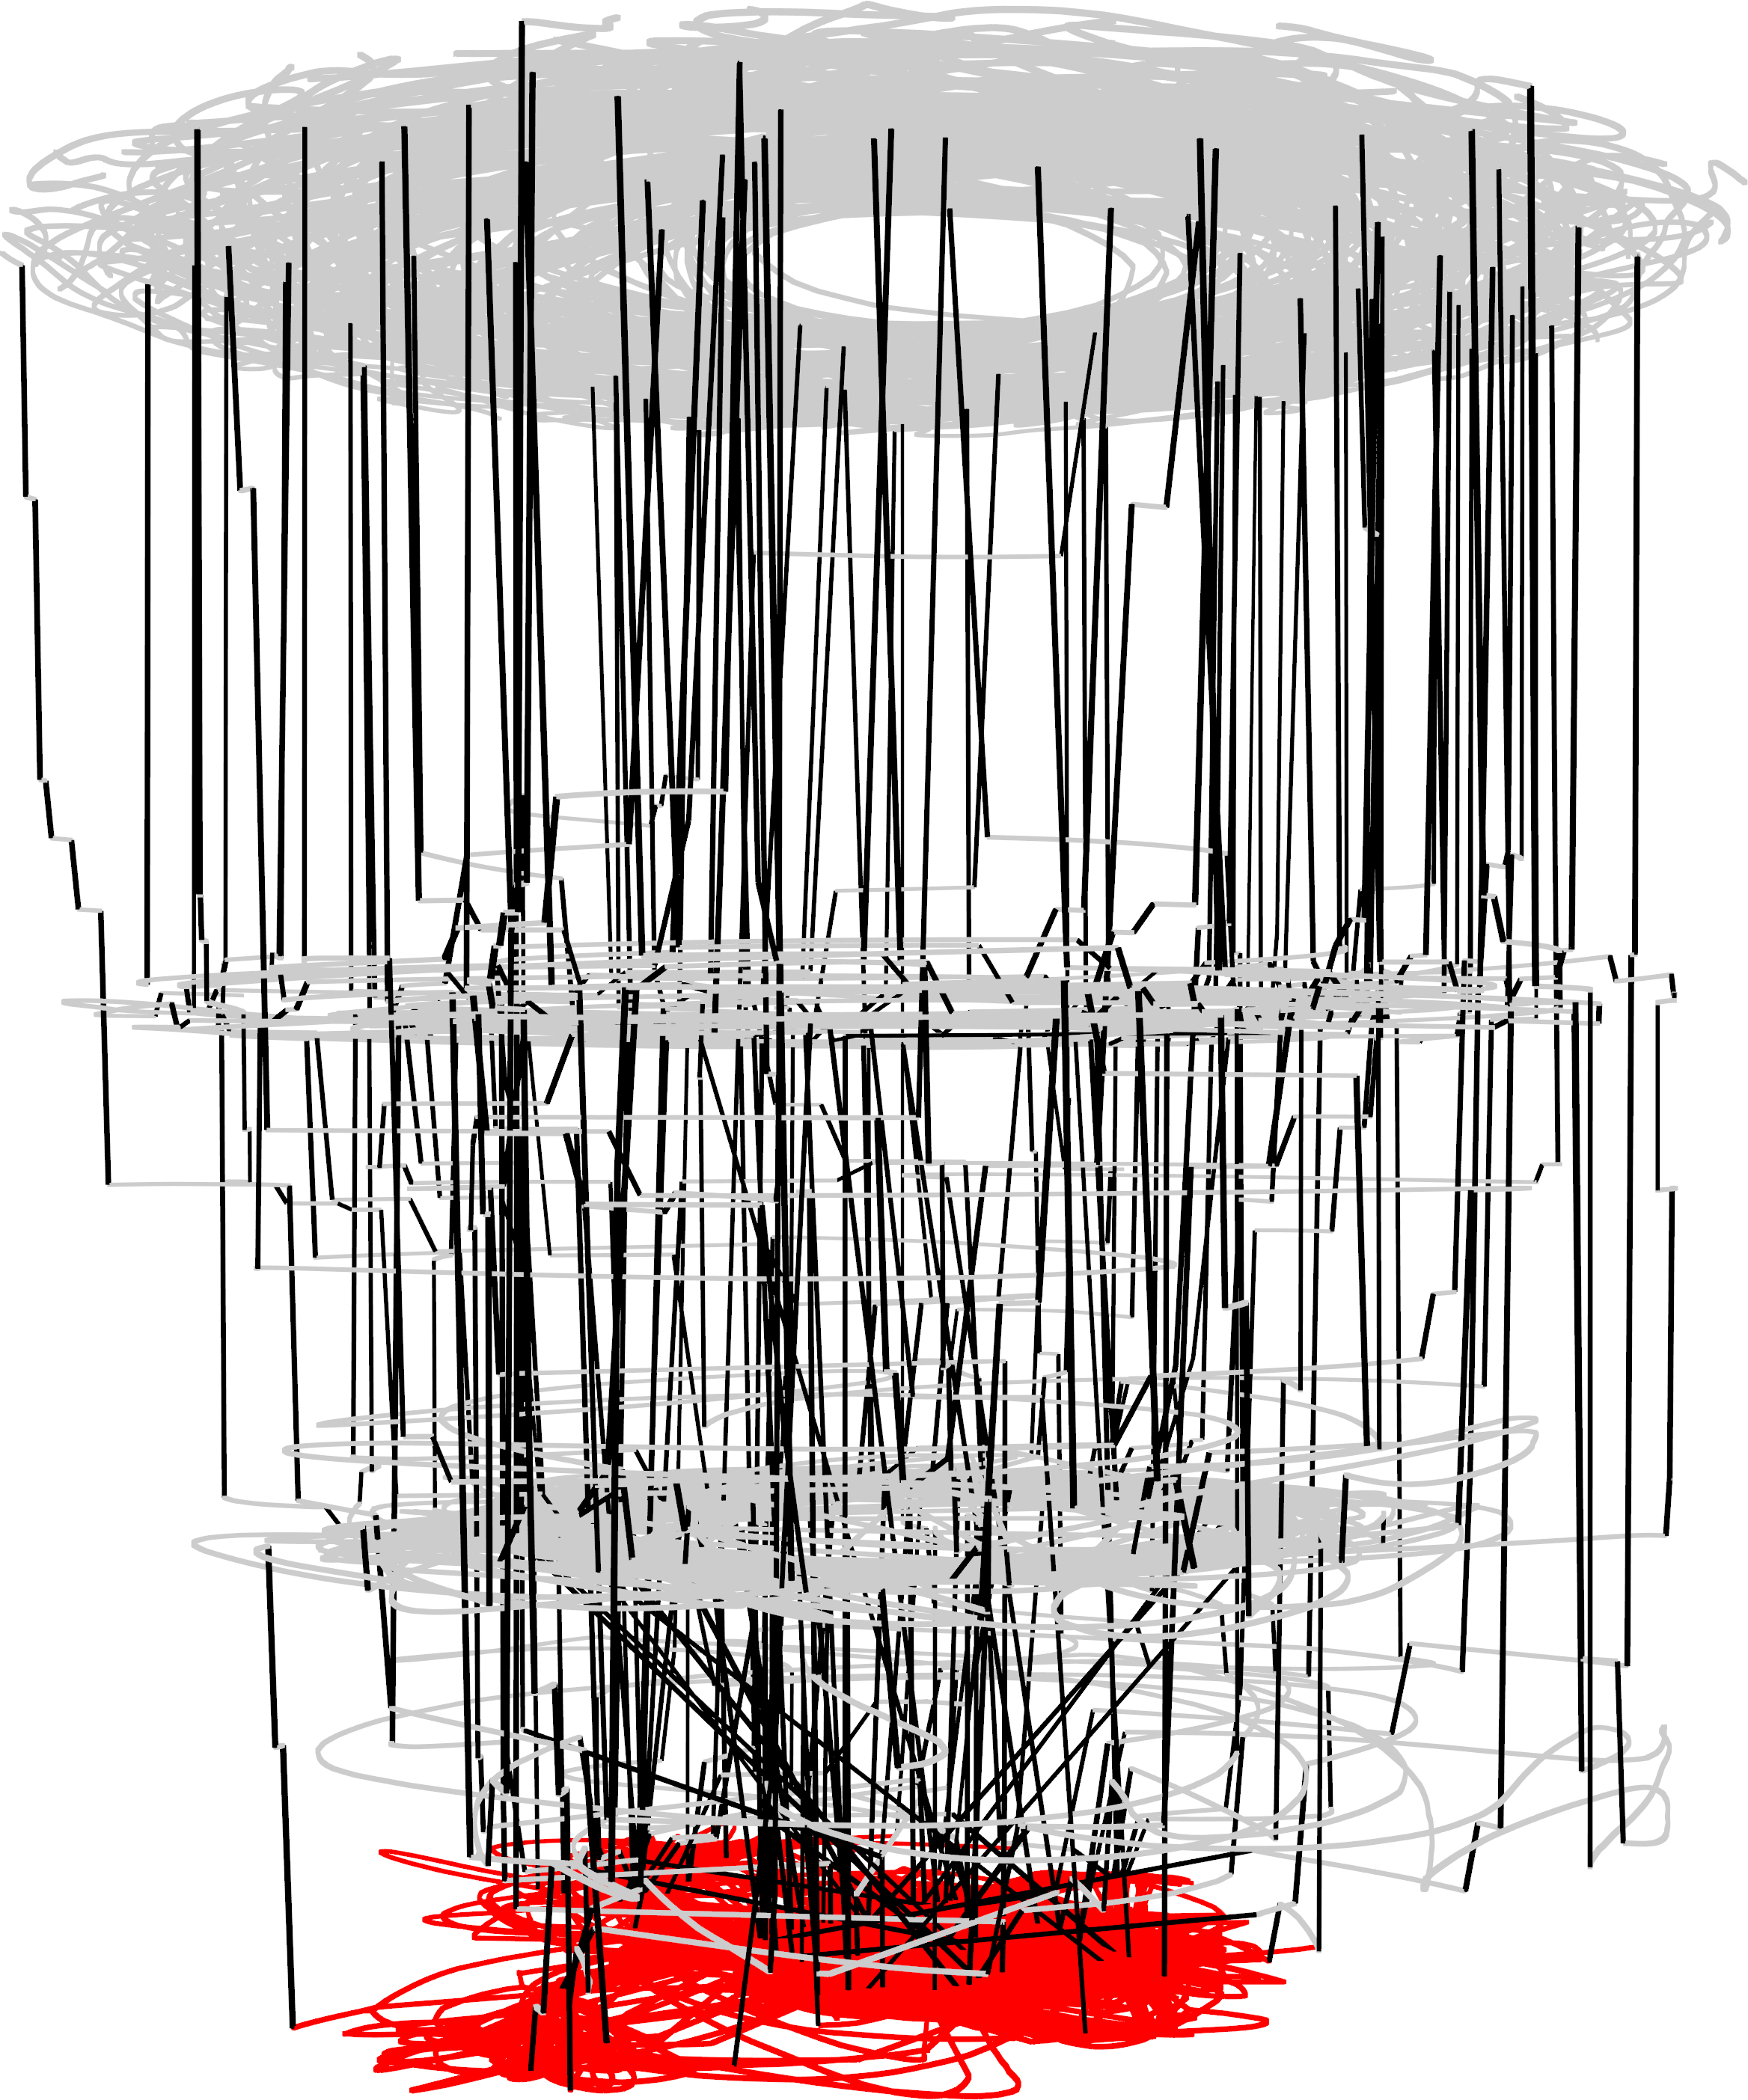
3D LON visualisations, where the z coordinate represents fitness (cost), are introduced for this first time. The 3D plots provide a concrete and intuitive depiction of the fit tness landscape metaphor and the notion of funnels. We explored in detail the funnel floors and their connectivity. A funnel floor solution is a high quality local optimum that is conjectured to be at the bottom of a funnel. They are located by running Chained-LK for a large enough number of iterations and recognised by the lack of downward progress after a large number of double-bridge escape attempts. We found that a stronger perturbation can help in smoothing the funnel structure, that is, reducing the number of funnels and making the global optima more reachable.
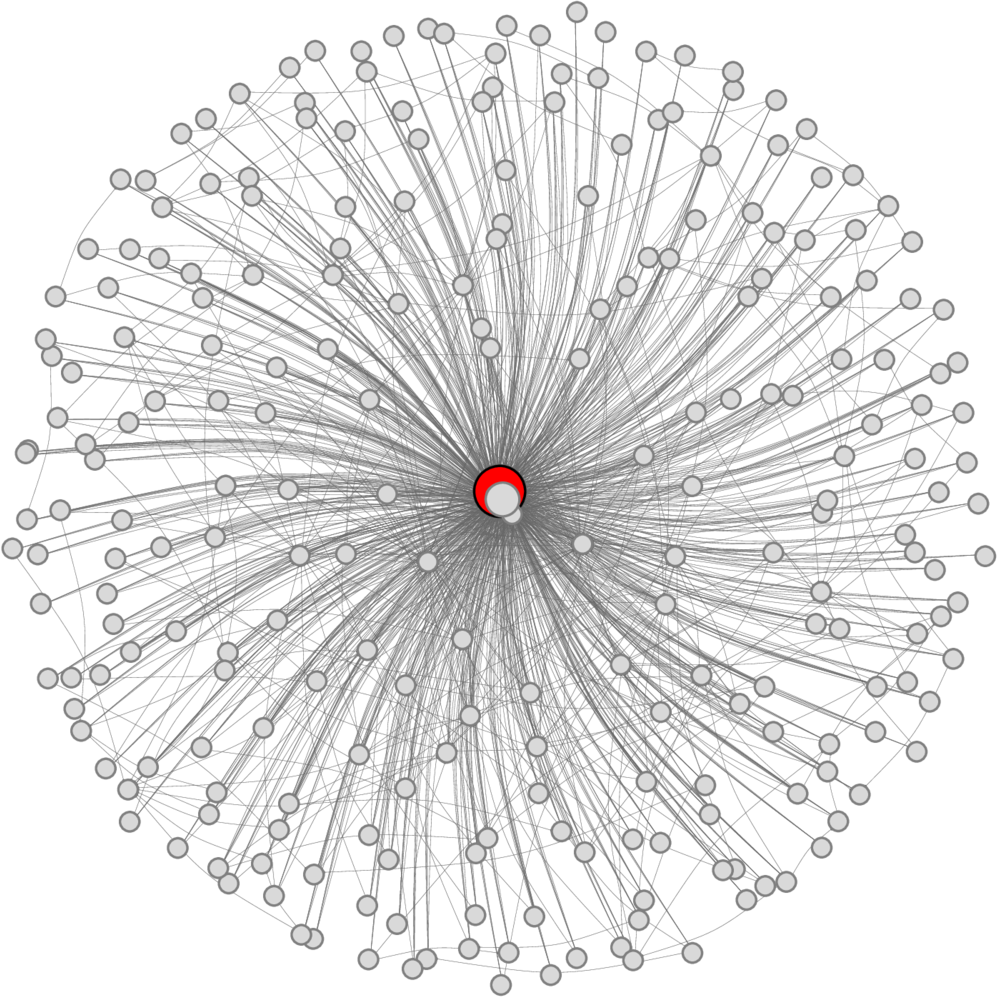
Funnel floor network for Instance att532. Node color is fitness level. Node size is incoming degree.
The colours of nodes identify funnels characterised with monotonic sequences (sequence of connected optima with no-deteriorating fitness). We used the heat colours palette, a sequential colour scheme skewed to the reds and yellows. Red identifies the global optima, and the yellow colour gradient reflects an increase in cost. The 2nd row represents a 3D view of the respective LON at the top.
2D LON for random clustered Instance C1243. Node colour represents fitness. Node size represents incoming weighted degree (strength).
3D LON for Chained-LK on asymmetric TSP instance rbg323.
Separate paths, none of them reaching a global optimum. <\br> Veerapen Nadarajen; Ochoa, Gabriela; Tinós, Renato; Whitley, Darrell.Tunnelling Crossover Networks for the Asymmetric TSP PPSN XIV, pp. 994–1003, Springer, 2016.
3D LON for Hybrid GA on asymmetric TSP instance rbg323. Red nodes are global opitma. A single generation is enough to tunnel through to global optima.
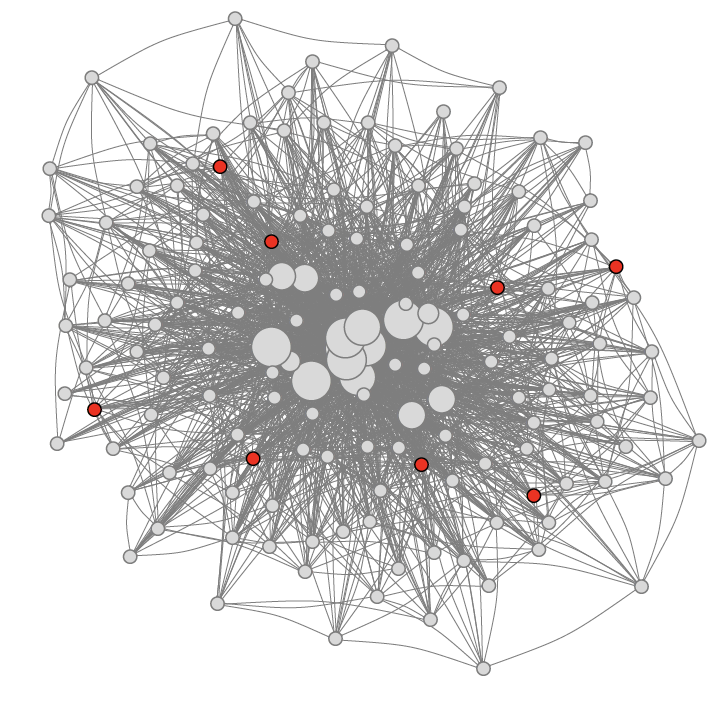
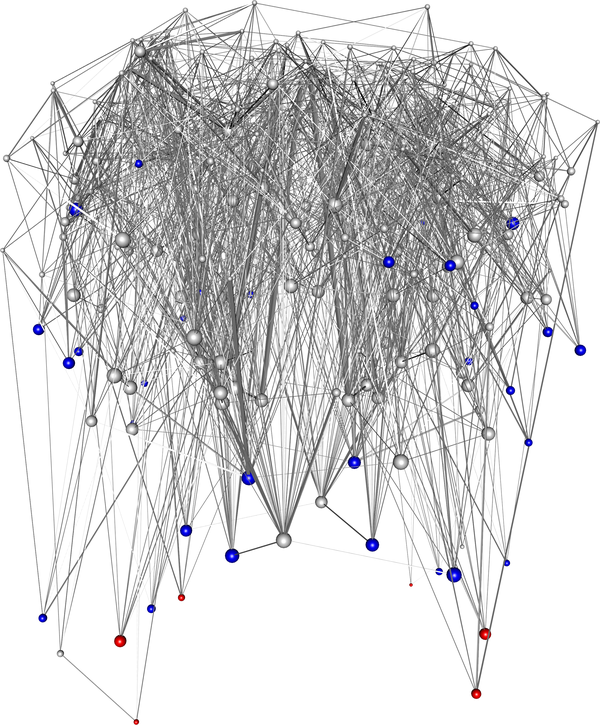
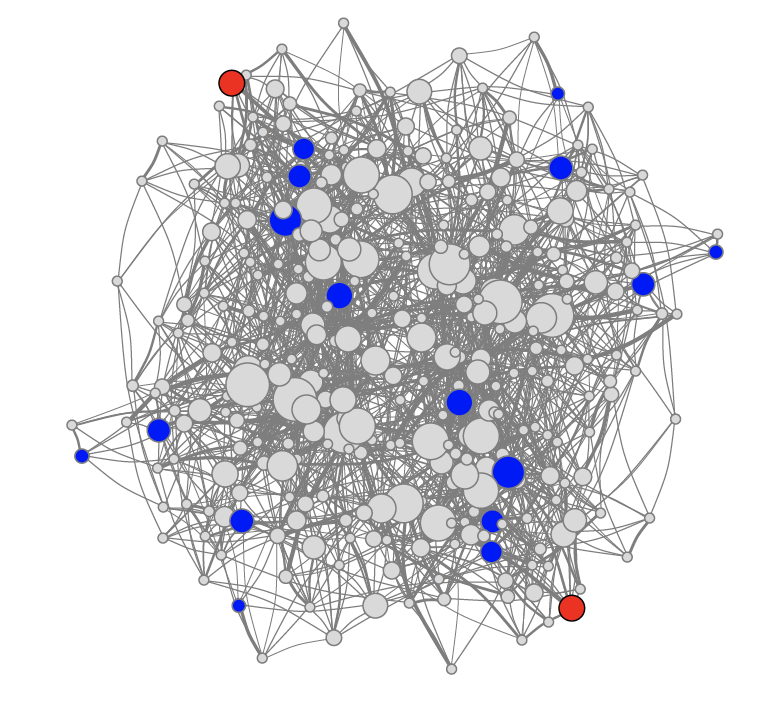
LON for TSP random clustered instance C755. Perturbation strength: 10 double-bridge moves%.
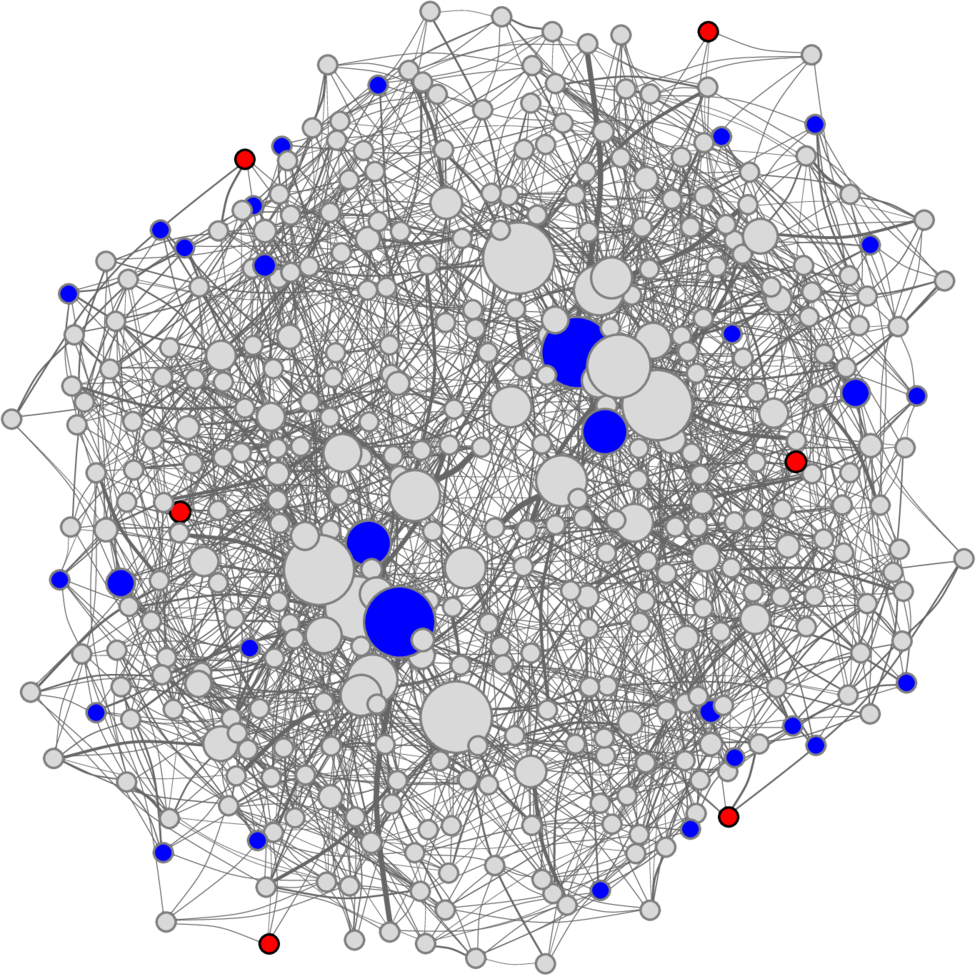
Red nodes belong to global optimal funnels. Blue nodes to suboptimal funnels. Larger nodes identify funnel bottoms (sinks). McMenemy, Paul; Veerapen, Nadarajen; Ochoa, Gabriela.How Perturbation Strength Shapes the Global Structure of TSP Fitness Landscapes Evolutionary Computation in Combinatorial Optimization - EvoCOP 2018, pp. 34–49, Springer, 2018.
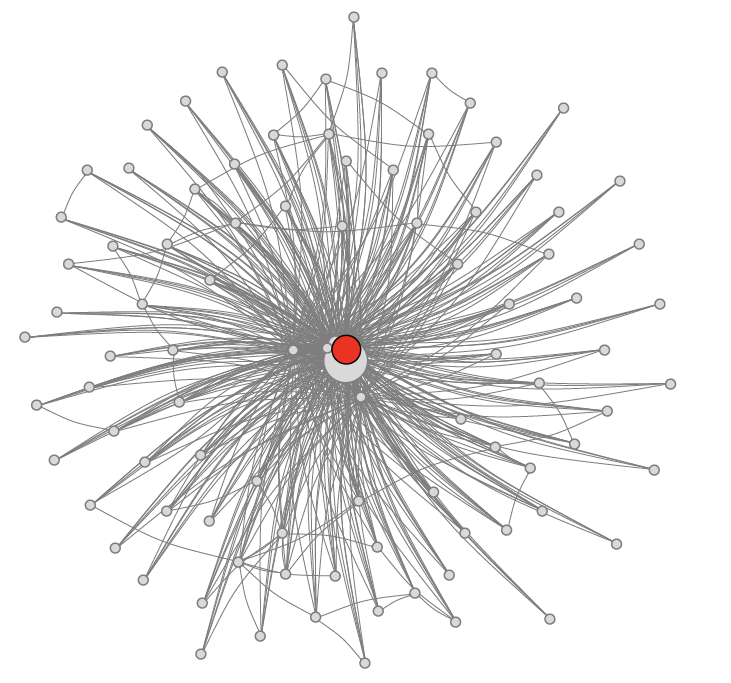
LON for TSP random uniform instance E755. Perturbation strength: 1 double-bridge moves.
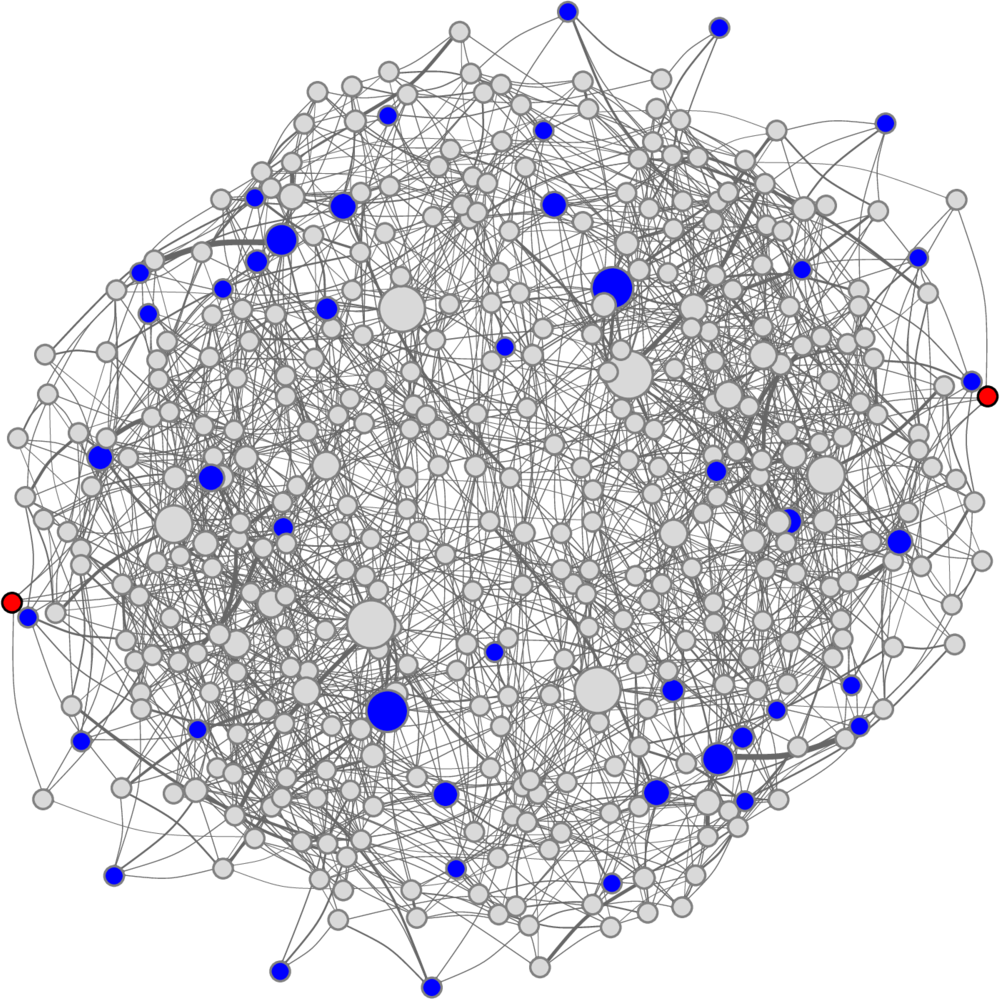
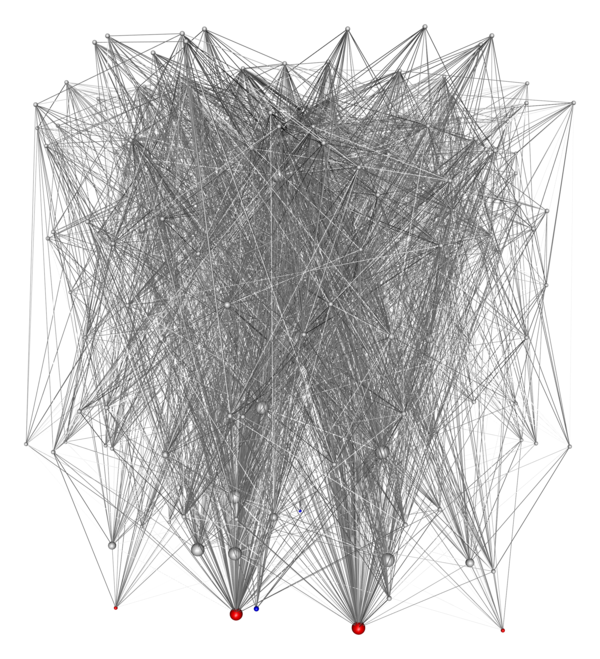
LON for QAP instance tho40. Perturbation strength: 12.5% .
Red nodes belong to global optimal funnels. Blue nodes to suboptimal funnels. Brighter colours identify Funnel bottoms (sinks). Ochoa, Gabriela; Herrmann, Sebastian. Perturbation Strength and the Global Structure of QAP PPSN XV, to appear, Springer, 2018.
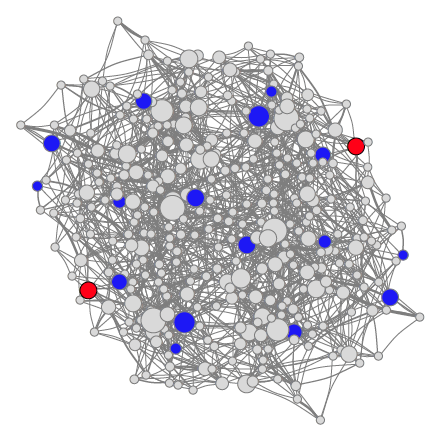
LON for QAP instance kra30b. Perturbation strength: 25%.
Red nodes belong to global optimal funnels. Blue nodes to suboptimal funnels. Brighter colours identify Funnel bottoms (sinks). Ochoa, Gabriela; Herrmann, Sebastian. Perturbation Strength and the Global Structure of QAP PPSN XV, to appear, Springer, 2018.
LON for QAP instance kra30b. Perturbation strength: 50%.
Red nodes belong to global optimal funnels. Blue nodes to suboptimal funnels. Brighter colours identify Funnel bottoms (sinks). Ochoa, Gabriela; Herrmann, Sebastian. Perturbation Strength and the Global Structure of QAP PPSN XV, to appear, Springer, 2018.
LON for QAP instance kra30b. Perturbation strength: 75%.
Red nodes belong to global optimal funnels. Blue nodes to suboptimal funnels. Brighter colours identify Funnel bottoms (sinks). Ochoa, Gabriela; Herrmann, Sebastian. Perturbation Strength and the Global Structure of QAP PPSN XV, to appear, Springer, 2018.
LON for QAP instance kra30b. Perturbation: restart.
Red nodes belong to global optimal funnels. Blue nodes to suboptimal funnels. Brighter colours identify Funnel bottoms (sinks). Ochoa, Gabriela; Herrmann, Sebastian. Perturbation Strength and the Global Structure of QAP PPSN XV, to appear, Springer, 2018.
LON for QAP instance nug30. Perturbation strength: 12.5% .
Red nodes belong to global optimal funnels. Blue nodes to suboptimal funnels. Brighter colours identify Funnel bottoms (sinks). Ochoa, Gabriela; Herrmann, Sebastian. Perturbation Strength and the Global Structure of QAP PPSN XV, to appear, Springer, 2018.
LON for QAP instance nug30. Perturbation strength: 25 %.
Red nodes belong to global optimal funnels. Blue nodes to suboptimal funnels. Brighter colours identify Funnel bottoms (sinks). Ochoa, Gabriela; Herrmann, Sebastian. Perturbation Strength and the Global Structure of QAP PPSN XV, to appear, Springer, 2018.
LON for QAP instance nug30. Perturbation strength: 50%.
Red nodes belong to global optimal funnels. Blue nodes to suboptimal funnels. Brighter colours identify Funnel bottoms (sinks). Ochoa, Gabriela; Herrmann, Sebastian. Perturbation Strength and the Global Structure of QAP PPSN XV, to appear, Springer, 2018.
LON for QAP instance nug30. Perturbation strength: 75%.
Red nodes belong to global optimal funnels. Blue nodes to suboptimal funnels. Brighter colours identify Funnel bottoms (sinks). Ochoa, Gabriela; Herrmann, Sebastian. Perturbation Strength and the Global Structure of QAP PPSN XV, to appear, Springer, 2018.
LON for QAP instance nug30. Perturbation strength: restart.
Red nodes belong to global optimal funnels. Blue nodes to suboptimal funnels. Brighter colours identify Funnel bottoms (sinks). Ochoa, Gabriela; Herrmann, Sebastian. Perturbation Strength and the Global Structure of QAP PPSN XV, to appear, Springer, 2018.
LON for QAP instance tho40. Perturbation strength: 12.5%.
Red nodes belong to global optimal funnels. Blue nodes to suboptimal funnels. Brighter colours identify Funnel bottoms (sinks). Ochoa, Gabriela; Herrmann, Sebastian. Perturbation Strength and the Global Structure of QAP PPSN XV, to appear, Springer, 2018.
LON for QAP instance tho40. Perturbation strength: 25%.
Ochoa, GabrielRed nodes belong to global optimal funnels. Blue nodes to suboptimal funnels. Brighter colours identify Funnel bottoms (sinks). Ochoa, Gabriela; Herrmann, Sebastian. Perturbation Strength and the Global Structure of QAP PPSN XV, to appear, Springer, 2018.
LON for QAP instance tho40. Perturbation strength: 50%.
Red nodes belong to global optimal funnels. Blue nodes to suboptimal funnels. Brighter colours identify Funnel bottoms (sinks). Ochoa, Gabriela; Herrmann, Sebastian. Perturbation Strength and the Global Structure of QAP PPSN XV, to appear, Springer, 2018.
LON for QAP instance tho40. Perturbation strength: 75%.
Red nodes belong to global optimal funnels. Blue nodes to suboptimal funnels. Brighter colours identify Funnel bottoms (sinks). Ochoa, Gabriela; Herrmann, Sebastian. Perturbation Strength and the Global Structure of QAP PPSN XV, to appear, Springer, 2018.
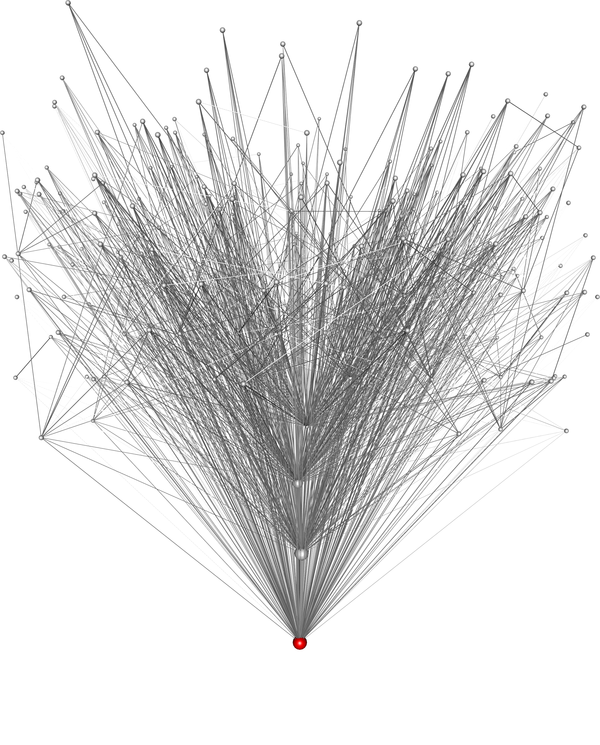
LON for QAP instance tho40. Perturbation strength: restart.
Red nodes belong to global optimal funnels. Blue nodes to suboptimal funnels. Brighter colours identify Funnel bottoms (sinks). Ochoa, Gabriela; Herrmann, Sebastian. Perturbation Strength and the Global Structure of QAP PPSN XV, to appear, Springer, 2018.
LON for QAP instance sko42. Perturbation strength: 12.5%.
Red nodes belong to global optimal funnels. Blue nodes to suboptimal funnels. Brighter colours identify Funnel bottoms (sinks). Ochoa, Gabriela; Herrmann, Sebastian. Perturbation Strength and the Global Structure of QAP PPSN XV, to appear, Springer, 2018.
LON for QAP instance sko42. Perturbation strength: 25%.
Red nodes belong to global optimal funnels. Blue nodes to suboptimal funnels. Brighter colours identify Funnel bottoms (sinks). Ochoa, Gabriela; Herrmann, Sebastian. Perturbation Strength and the Global Structure of QAP PPSN XV, to appear, Springer, 2018.
LON for QAP instance sko42. Perturbation strength: 50%.
Red nodes belong to global optimal funnels. Blue nodes to suboptimal funnels. Brighter colours identify Funnel bottoms (sinks). Ochoa, Gabriela; Herrmann, Sebastian. Perturbation Strength and the Global Structure of QAP PPSN XV, to appear, Springer, 2018.
LON for QAP instance sko42. Perturbation strength: 75%.
Red nodes belong to global optimal funnels. Blue nodes to suboptimal funnels. Brighter colours identify Funnel bottoms (sinks). Ochoa, Gabriela; Herrmann, Sebastian. Perturbation Strength and the Global Structure of QAP PPSN XV, to appear, Springer, 2018.
LON for QAP instance sko42. Perturbation strength: restart.
Red nodes belong to global optimal funnels. Blue nodes to suboptimal funnels. Brighter colours identify Funnel bottoms (sinks). Ochoa, Gabriela; Herrmann, Sebastian. Perturbation Strength and the Global Structure of QAP PPSN XV, to appear, Springer, 2018.
NK Landscapes
These LONs are the result of fully enumerating NK landscape instances of sizes from 15 up to 30 bits.
Tunnelling Crossover Networks, GECCO 2015
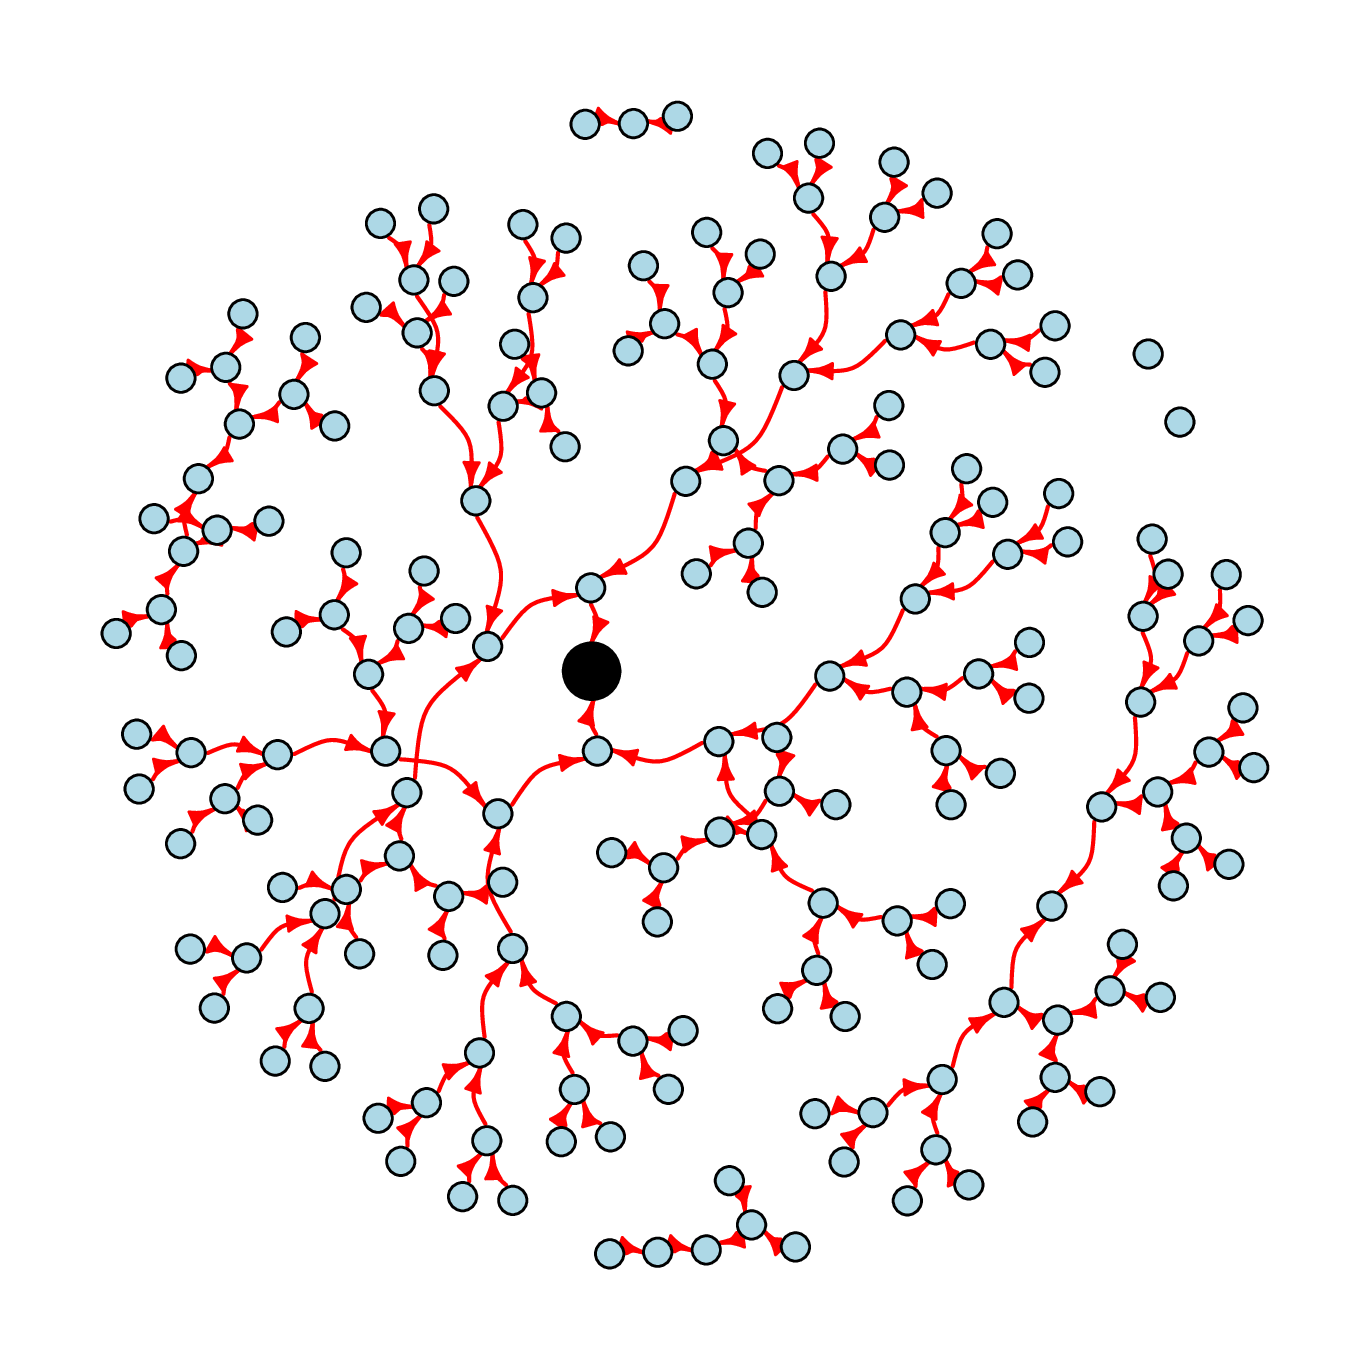
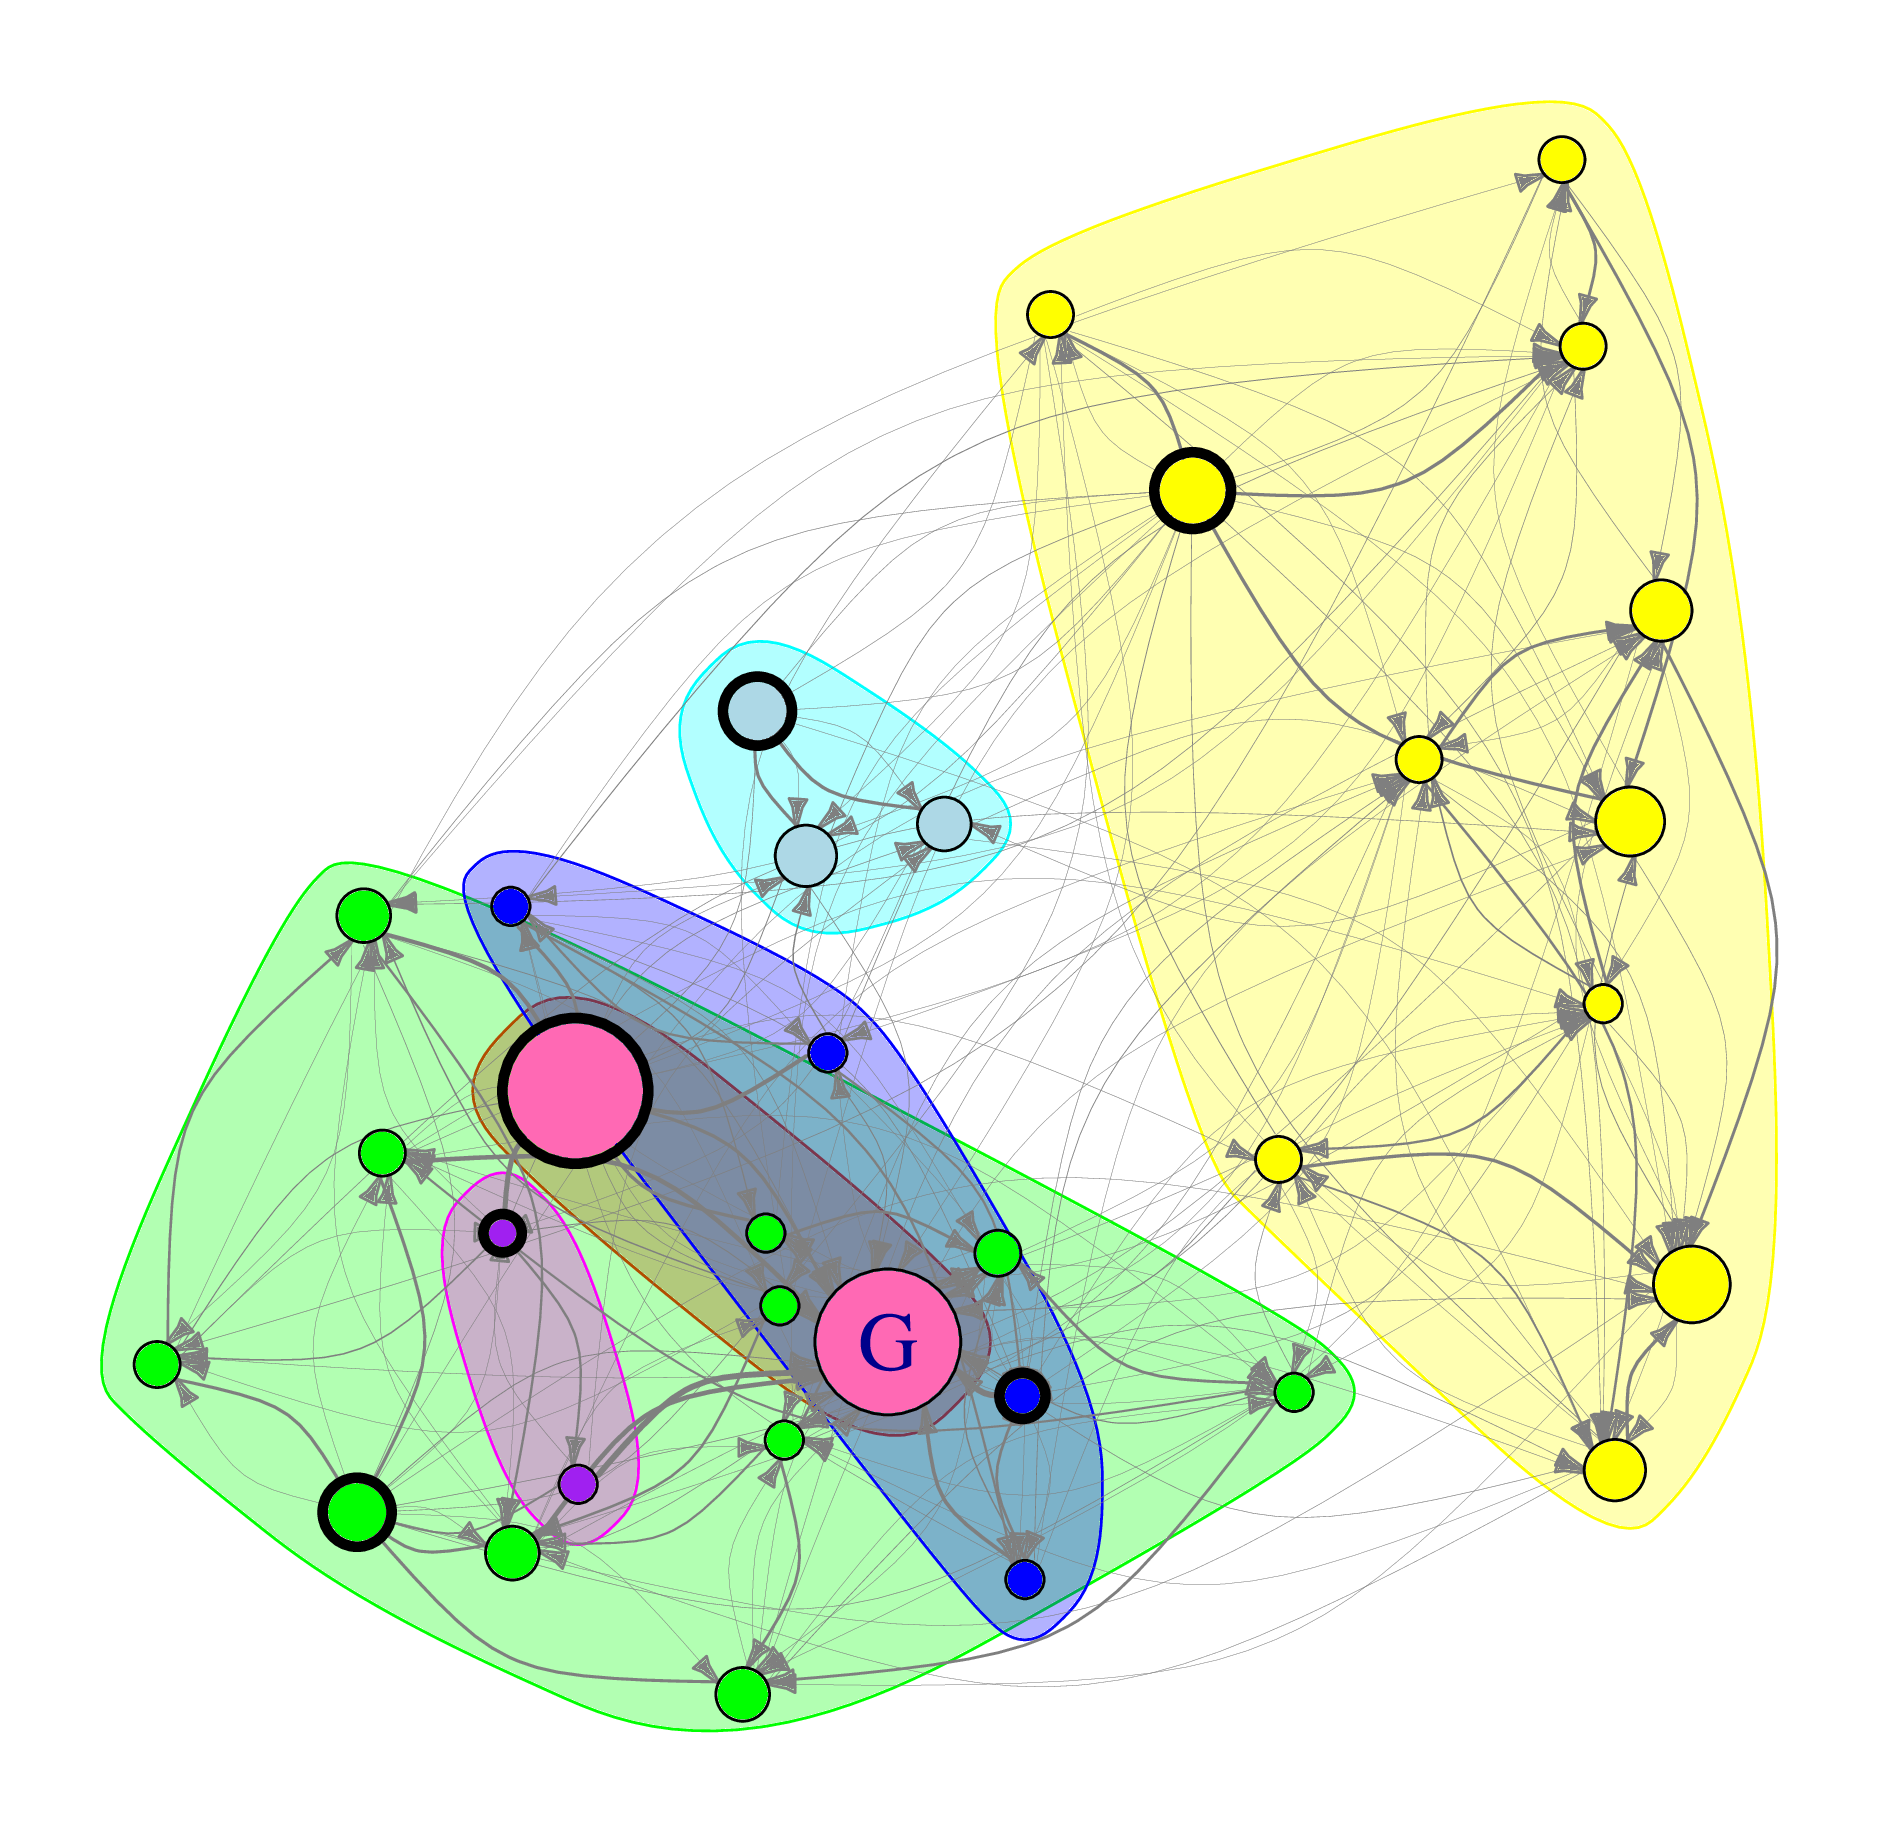
Transitions based on recombination are introduced for the first time in a LON model. We define and analyze networks based on partition crossover for k-bounded pseudo-Boolean functions, using NKq landscapes as a case study. Partition crossover was initially proposed for the TSP, where it was found to “tunnel” between local optima, i.e., jump from local optimum to local optimum. Gray-box optimisation techniques are used to efficiently compute all the global optima for landscapes of up to 30 bits. Our network analysis shows that this also happens for NK landscapes: local optima are densely connected via partition crossover. We found marked differences between the adjacent and ran-dom interaction NK models. Surprisingly, with the random model, instances have a lower number of local optima on average, but their networks are more sparse and decompose into several clusters. So the number of local optima is not always a predictor of search difficulty, instead, the distribution of optima can be a key factor underlying difficulty.
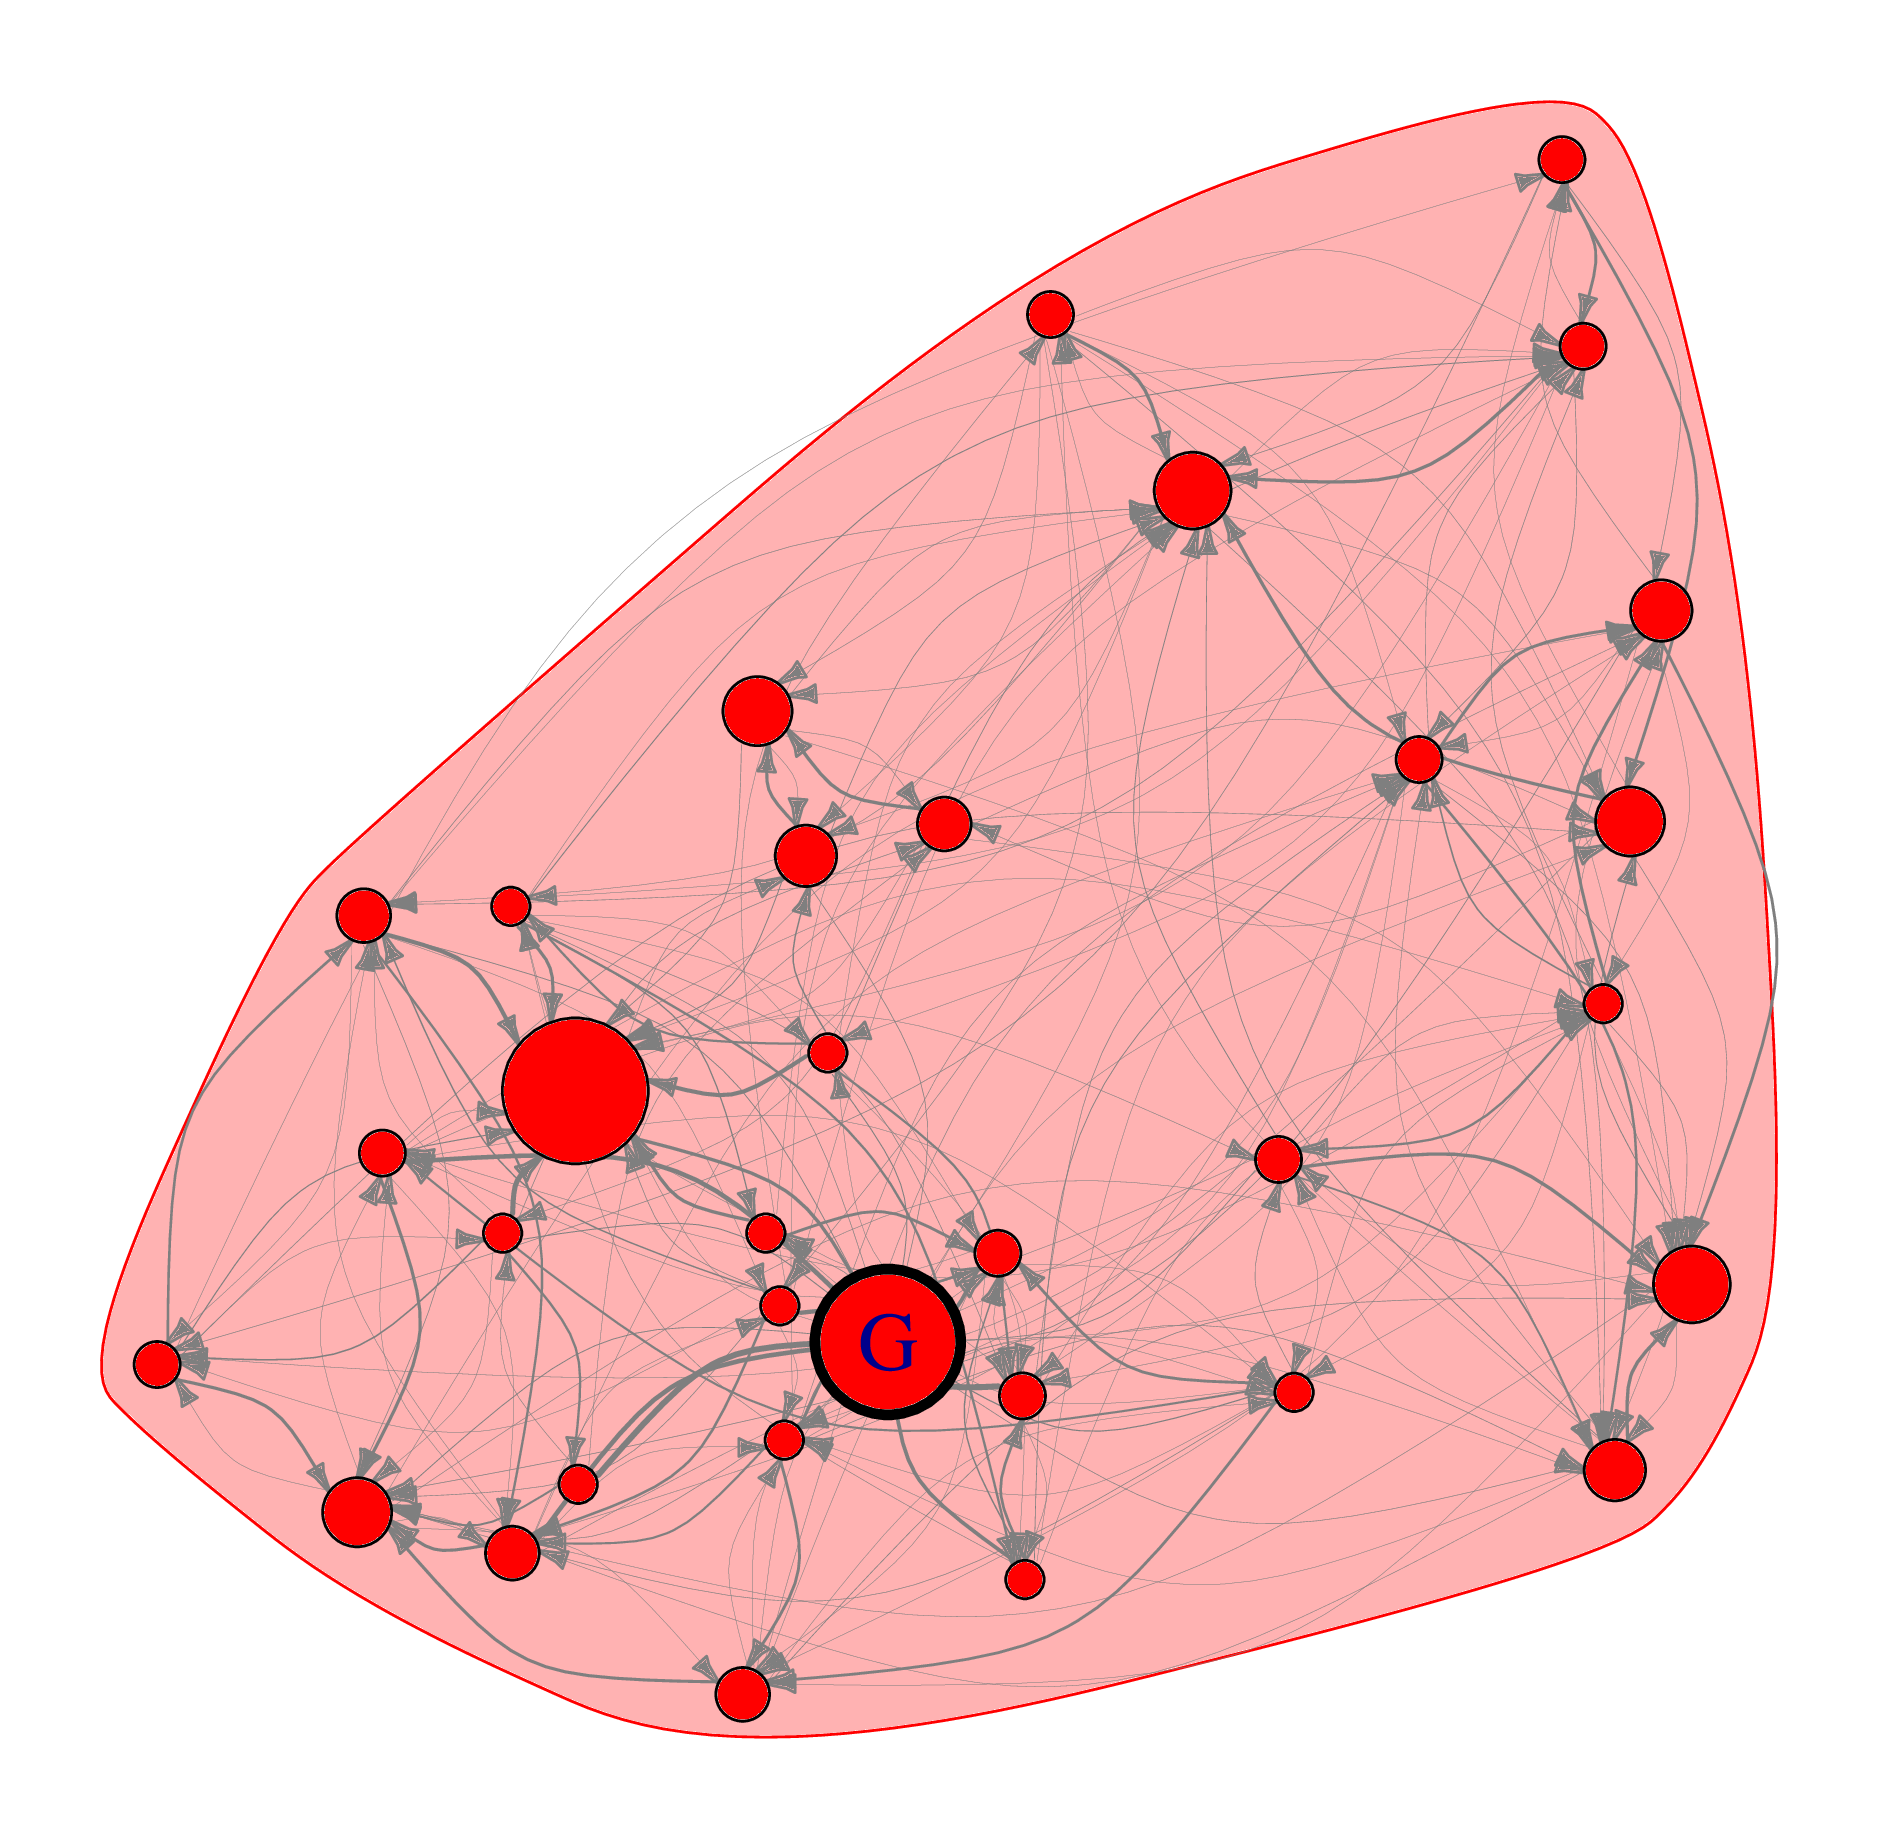
Local optima network with basin edges for 2ckx. The size is the log of the basin of attraction size. The color is the fitness: the better, the warmer. The thickness of the edges is proportional to the probability of passing from one basin to the other.


. Node colour is fitness level. Node size is incoming degree. Z coordinate is fitness.")
. Node colour is fitness level. Node size is incoming degree. Z coordinate is fitness.")


.")
.")
.")
.")

.")
.")
.")
.")